
-
×
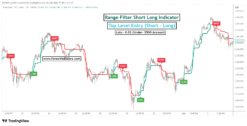 Range Filter Short Long Indicator
1 × $150.00
Range Filter Short Long Indicator
1 × $150.00 -
×
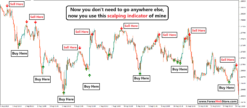 Buy Sell Arrow Non Repaint Indicator with alerts
1 × $229.00
Buy Sell Arrow Non Repaint Indicator with alerts
1 × $229.00
-86%


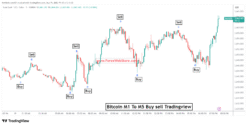
Buy Sell Supertrend M1 to H4
Original price was: $1,500.00.$211.00Current price is: $211.00.
If you want this indicator then you can pay crypto 189$ (Contact Admin) Click Here
- Original Indicator
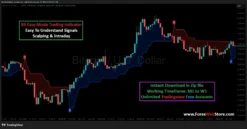
- Trading time: Every time
- Instant Download in Zip file
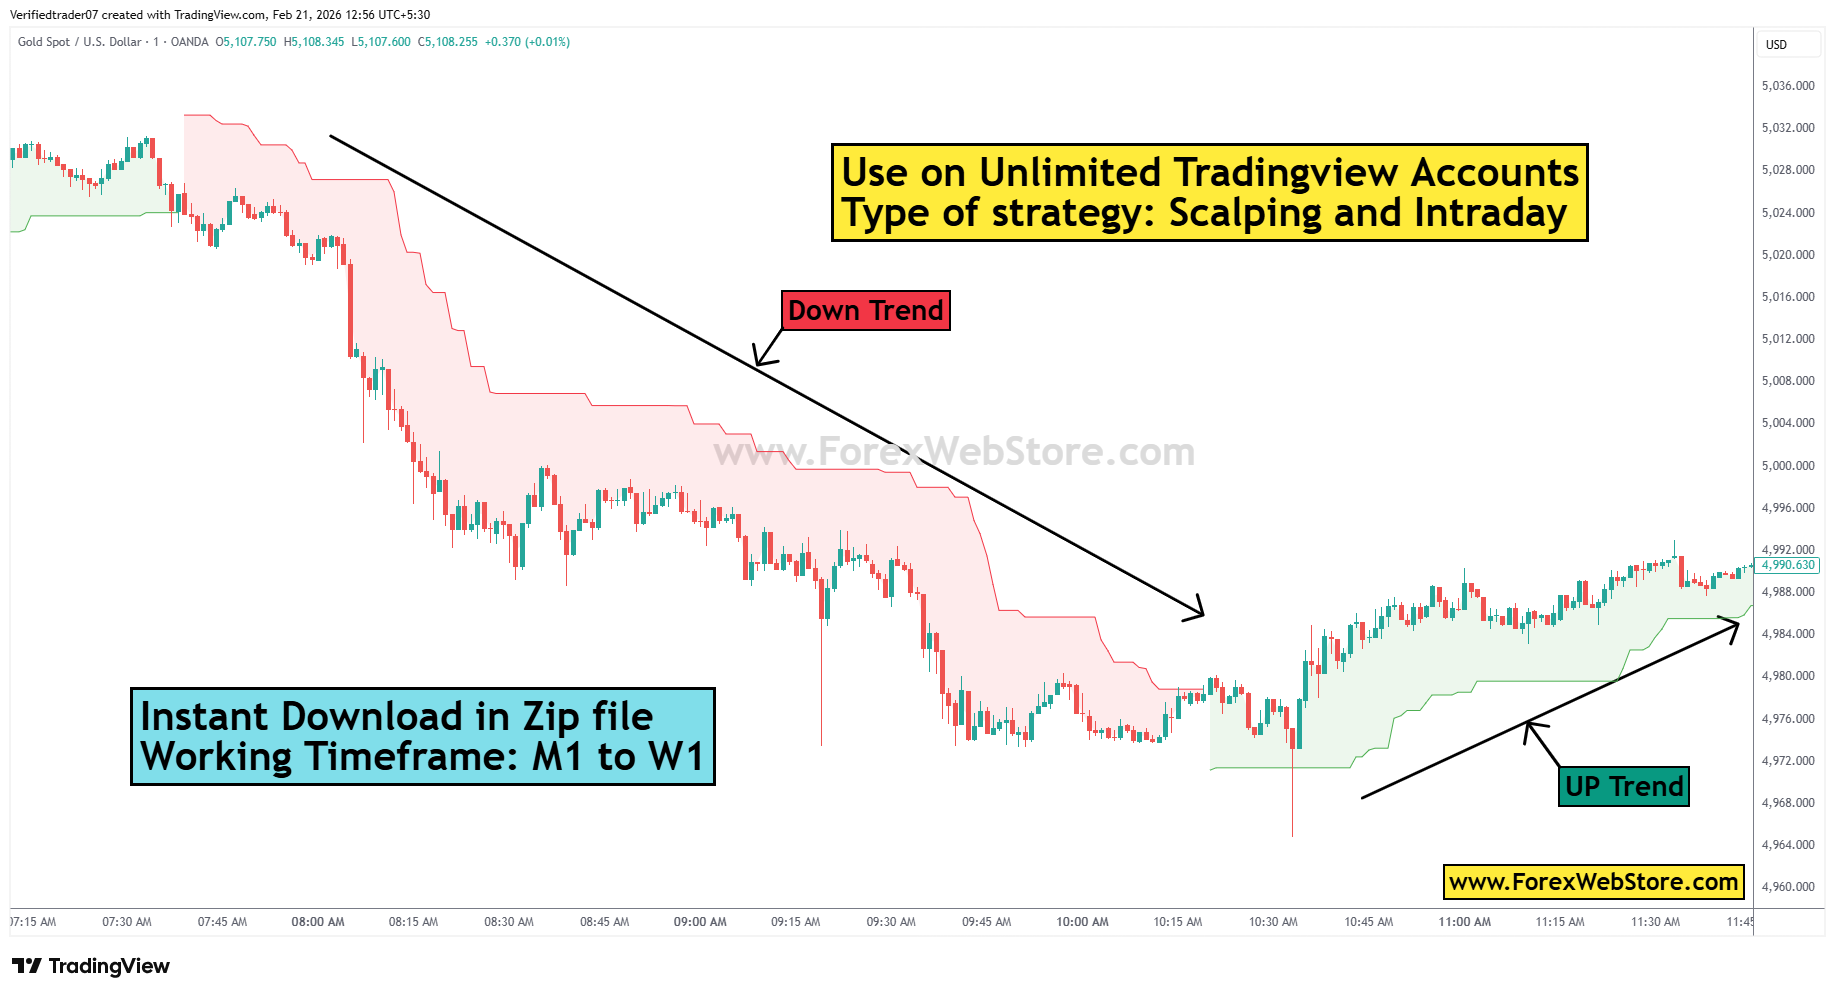
- Working Timeframe: M1 to W1
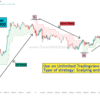
- Use on Unlimited Tradingview Accounts
- Type of strategy: Scalping and Intraday
- Source Code:- Pine script
- Works on All pairs Forex, Crypto, Stock Marke etc.
- Customer Support & Free Upgrades
- Lifetime Version
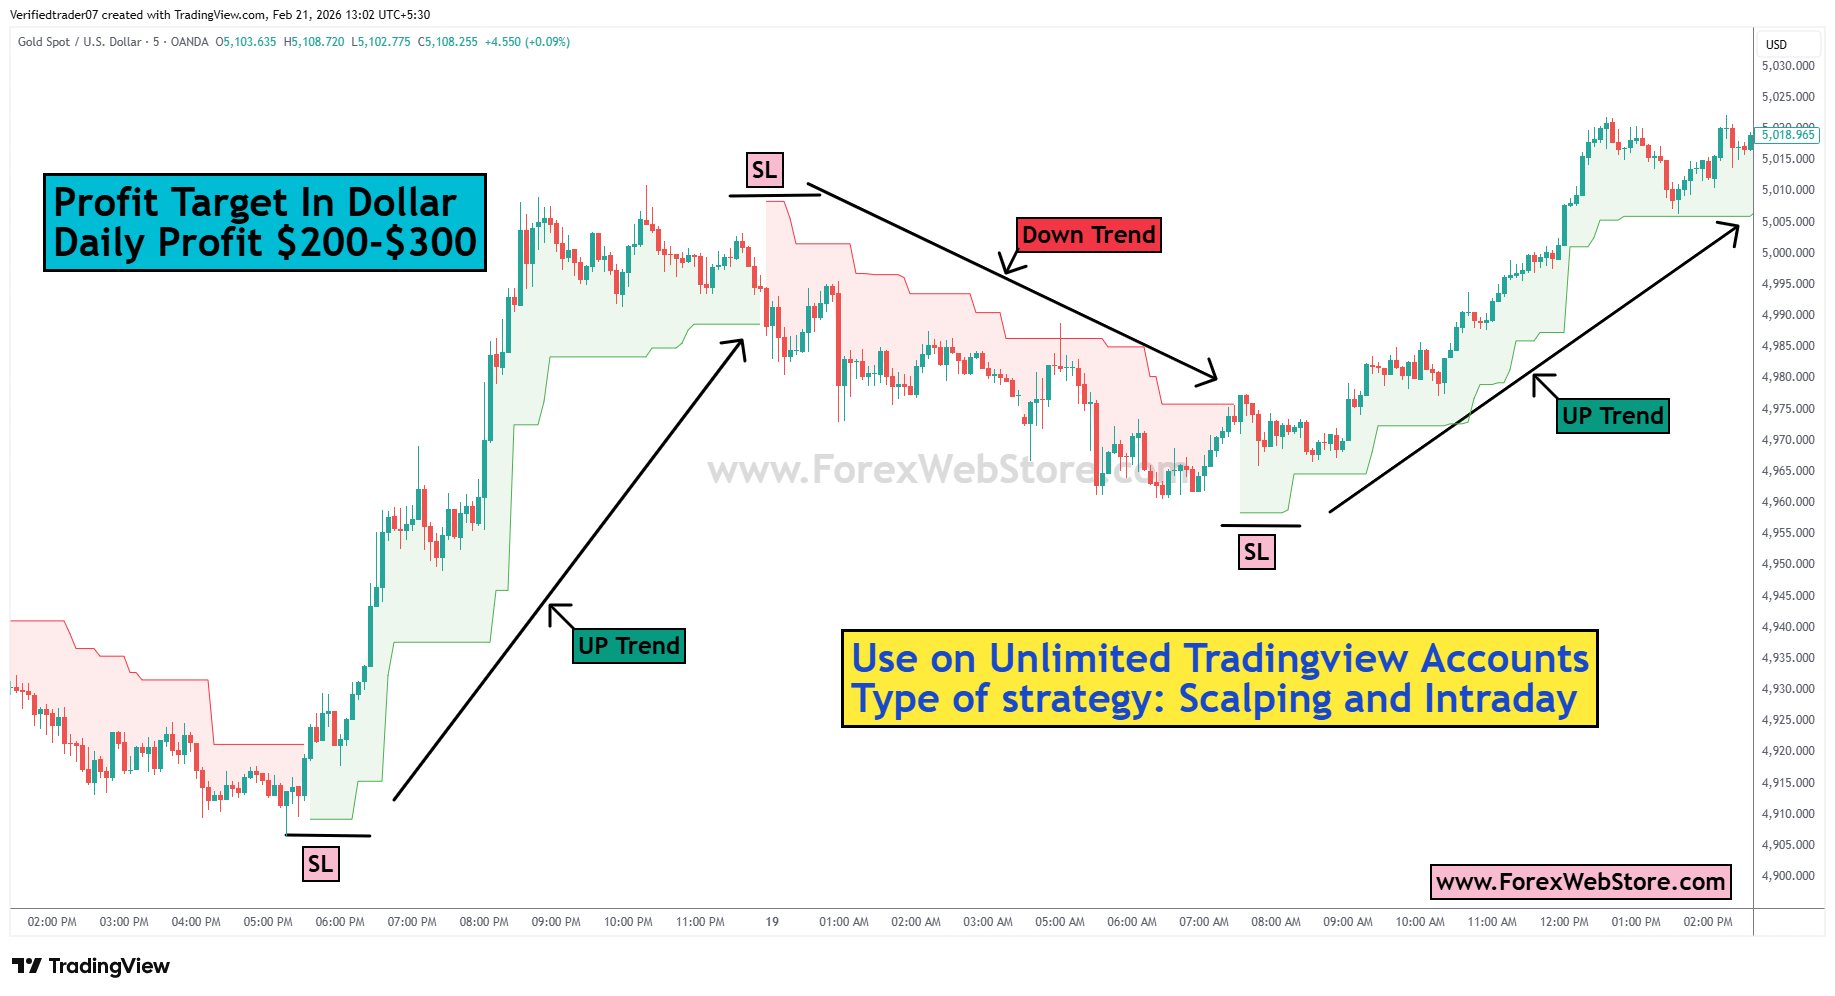
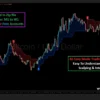
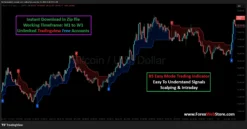
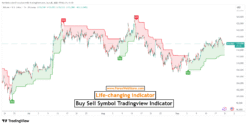
Understanding the Chart in the Image
Your chart has three main elements:
-
Candlesticks → Price movement
-
Colored Trend Cloud / Line
-
Red = Downtrend
-
Green = Uptrend
-
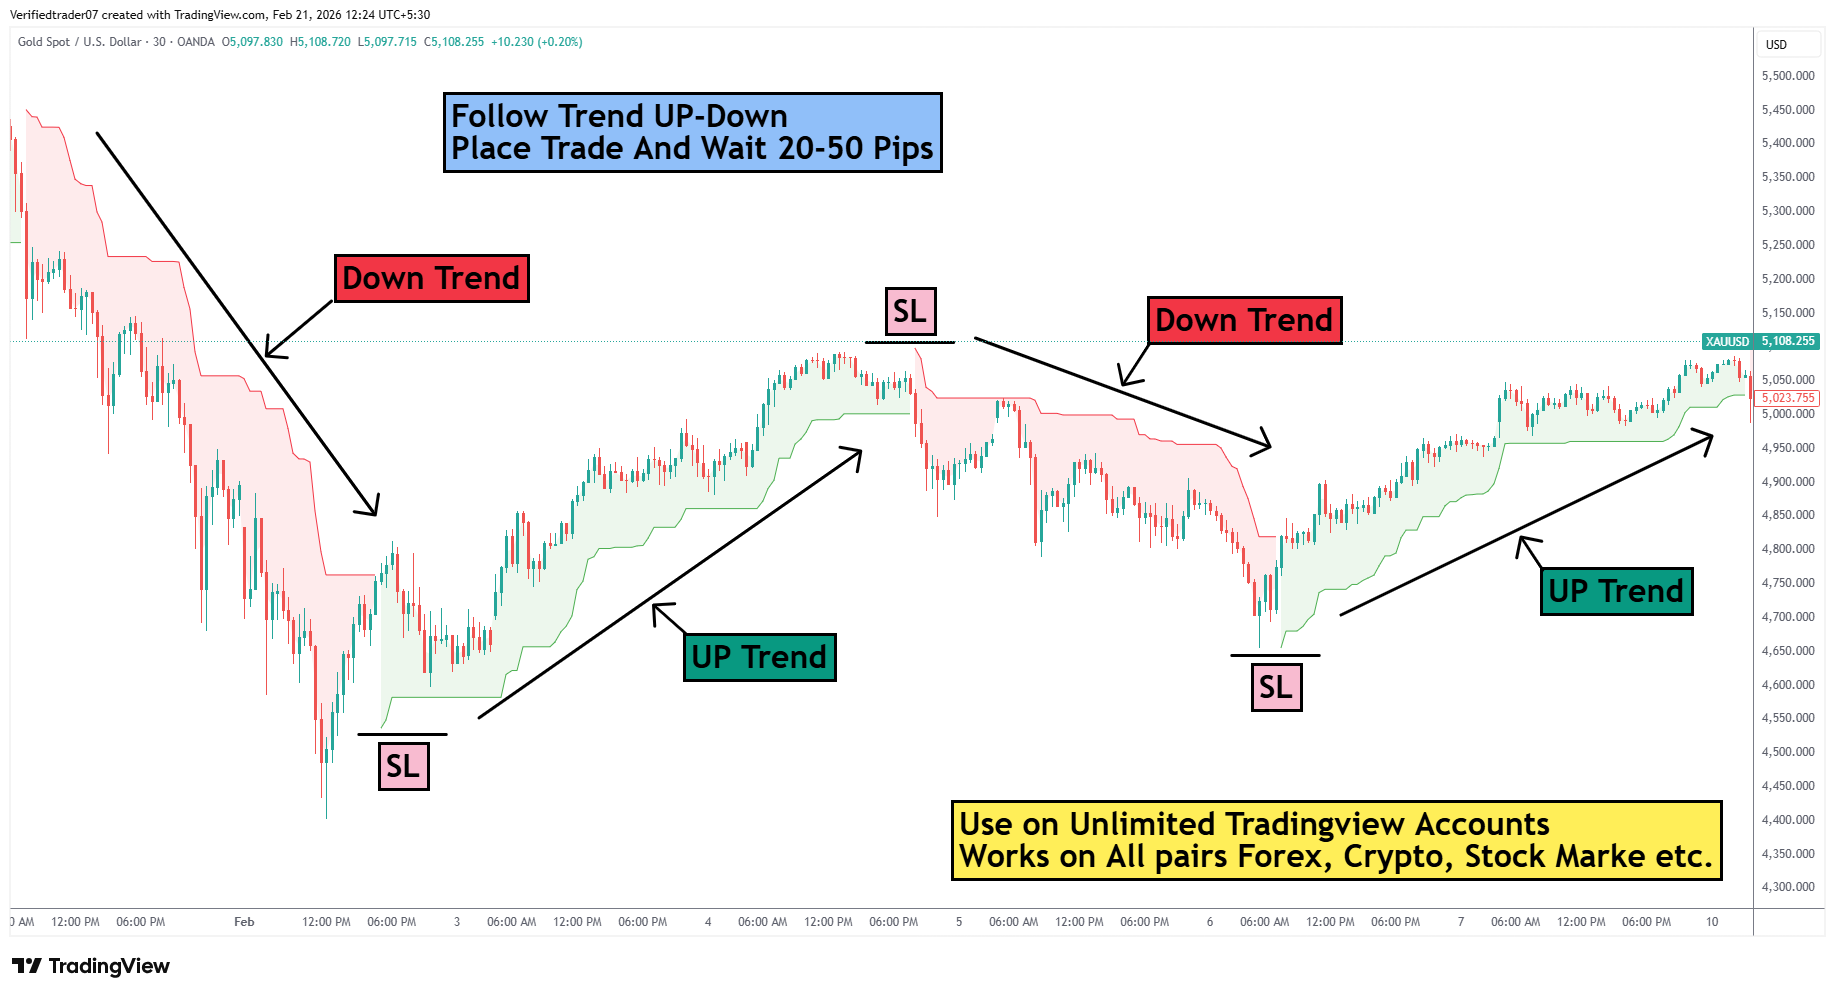
-
Stop Loss (SL) levels shown near swing highs/lows.
Basic Logic
-
Green cloud → Buy only
-
Red cloud → Sell only
-
Trade with the trend
-
Target = 20–50 pips

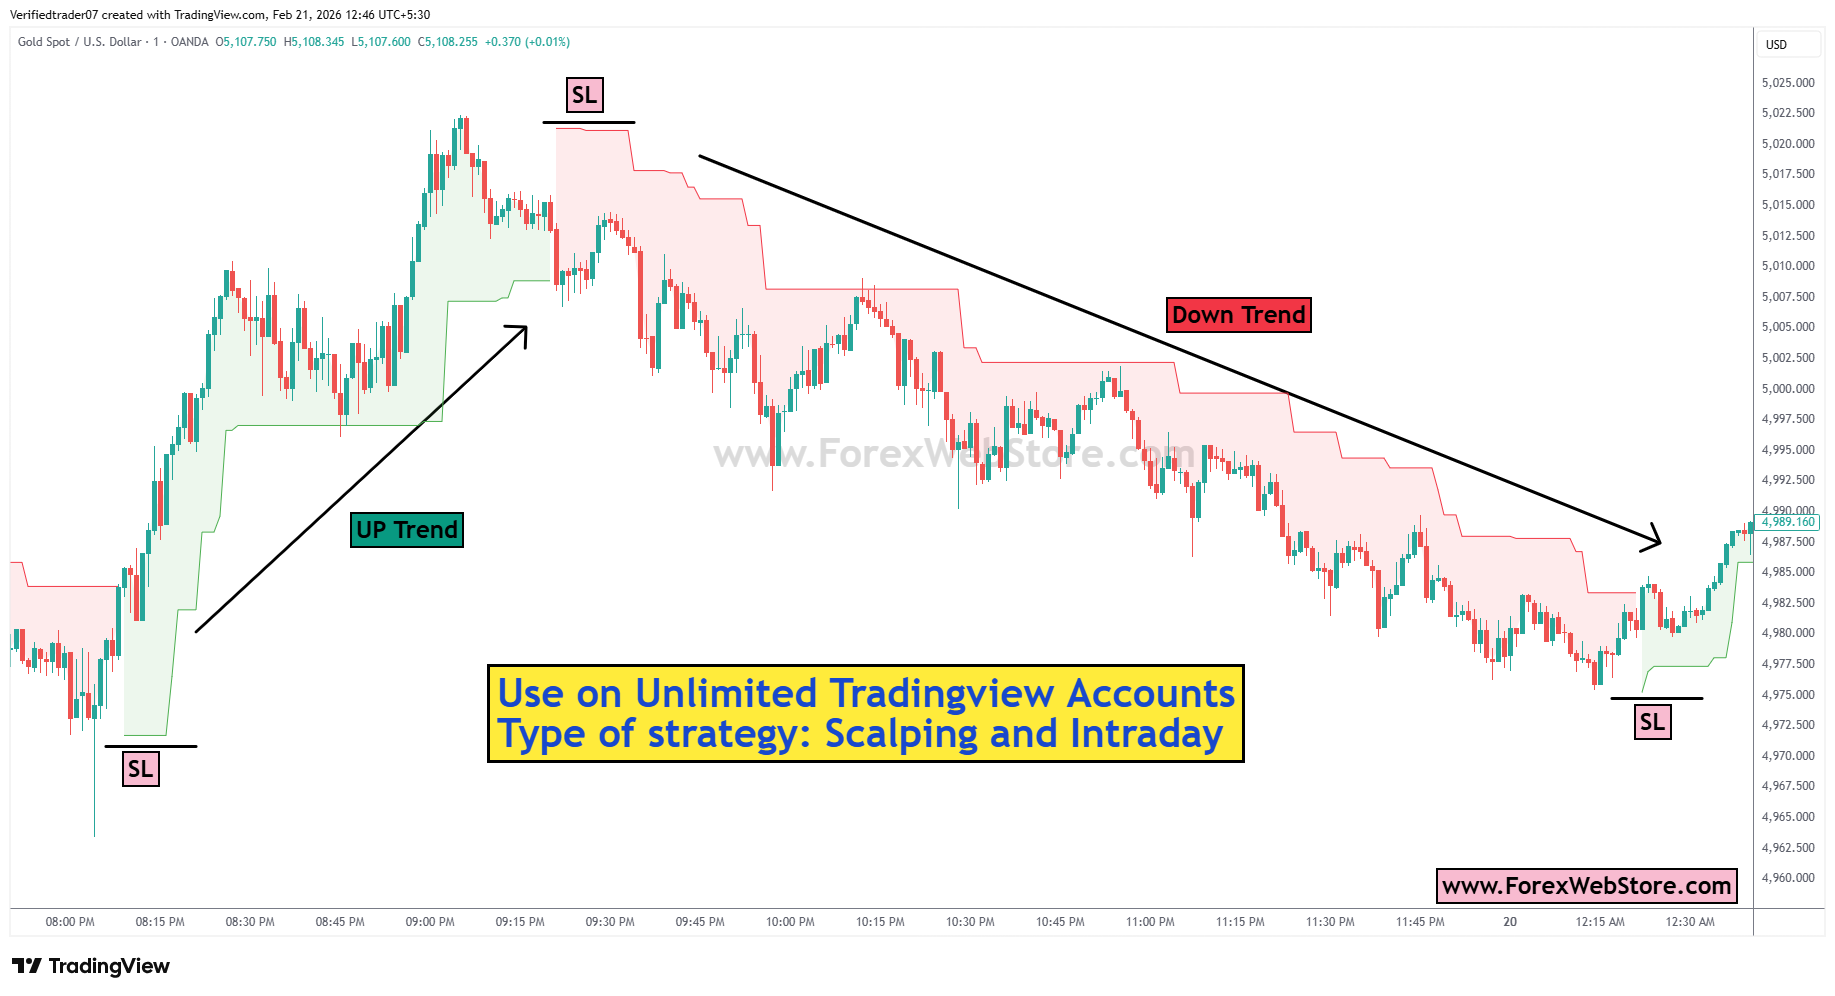
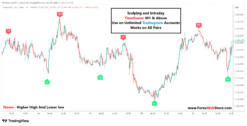
1. Entry Rules
The core of this strategy is the transition of the colored “cloud” or “ribbon” behind the price action.
-
Buy (Long) Entry:
-
Wait for the cloud to turn Green.
-
Ensure the price is trading above the green cloud.
-
Enter the trade when a candle closes firmly above a previous resistance or when the cloud first switches from red to green.
-
-
Sell (Short) Entry:
-
Wait for the cloud to turn Red.
-
Ensure the price is trading below the red cloud.
-
Enter the trade when the cloud switches from green to red and price breaks downward.
-
-
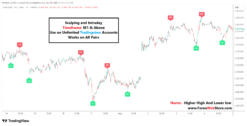
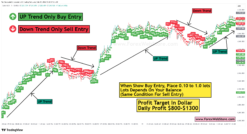
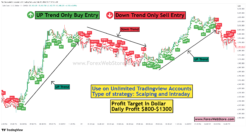
Buy Entry (UP Trend)
Take BUY when:
-
Indicator turns GREEN
-
Price is above the green cloud
-
Wait for small pullback / retracement
-
Enter Buy when candle closes bullish
Buy Example
-
Trend turns green
-
Price pulls back slightly
-
Next bullish candle forms
-
Enter BUY
-
-
Sell Entry (DOWN Trend)
Take SELL when:
-
Indicator turns RED
-
Price is below the red cloud
-
Wait for small pullback upward
-
Enter Sell when candle closes bearish
Sell Example
-
Trend turns red
-
Price retraces up slightly
-
Next bearish candle forms
-
Enter SELL
-

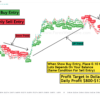
2. Stop Loss (SL) Placement
The image explicitly marks “SL” levels at the structural highs and lows.
-
For Buy Trades: Place your SL slightly below the most recent swing low or just below the bottom edge of the Green cloud.
-
For Sell Trades: Place your SL slightly above the most recent swing high or just above the top edge of the Red cloud.
-
Trailing SL: As the trend moves in your favor, you can move your SL along the edge of the cloud to lock in profits.
Your Stop Loss should always go behind the structure.
For BUY trades
Place Stop Loss:
Option 1 (Best)
Below the recent swing low
Option 2
Below the green cloud
Example:
Entry = 2000
SL = 1994
Risk = 6 pips
For SELL trades
Place Stop Loss:
Option 1 (Best)
Above the recent swing high
Option 2
Above the red cloud
Example:
Entry = 2000
SL = 2006
Risk = 6 pips

3. Target (Take Profit)
The strategy in the image suggests:
Target = 20 – 50 pips
You can choose:
| Style | Target |
|---|---|
| Scalping | 20 pips |
| Intraday | 30 pips |
| Strong Trend | 50 pips |
Profit Targets (Take Profit)
The chart notes suggest a specific scalping/day-trading target:
-
Primary Target: 20–50 Pips per trade.
-
Trend Riding: If the momentum is strong, you can close half of your position at 20 pips and let the rest run until the cloud changes color.

4. Risk Management
To stay profitable long-term, you must manage your “Capital at Risk.”
-
Risk per Trade: Never risk more than 1% to 2% of your total account balance on a single trade.
-
Risk-to-Reward (RR): Aim for at least a 1:1.5 or 1:2 ratio. For example, if your SL is 20 pips away, your target should be at least 30–40 pips.
-
Position Sizing: Calculate your lot size based on the distance to your SL so that the monetary loss remains within your 1-2% limit.
Important Trading Rules
-
Wait for Confirmation: Do not jump in the moment the color changes. Wait for a candle close to confirm the trend.
-
Avoid Sideways Markets: If the cloud is very thin and moving horizontally (flat), the market is ranging. This strategy works best in trending markets (sloping up or down).
-
Higher Timeframe Alignment: If you are trading on a 30-minute chart (as seen in the image), check the 4-hour chart. Only take “Buy” signals if the 4-hour trend is also bullish.
-
News Filter: Avoid entering new trades 30 minutes before or after “High Impact” economic news (like NFP or FOMC), as price gaps can hit your SL instantly.
Be the first to review “Buy Sell Supertrend M1 to H4”
Related products
-94%


Tradingview
Original price was: $3,958.00.$250.00Current price is: $250.00.
-95%
Tradingview
Original price was: $4,782.00.$250.00Current price is: $250.00.
-95%

Tradingview
Original price was: $3,999.00.$180.00Current price is: $180.00.
-96%
Tradingview
Original price was: $3,999.00.$149.00Current price is: $149.00.
-99%
Tradingview
Original price was: $20,000.00.$180.00Current price is: $180.00.
-96%
Tradingview
Original price was: $3,999.00.$140.00Current price is: $140.00.
-94%
Tradingview
Original price was: $3,999.00.$259.00Current price is: $259.00.
-89%

Tradingview
Original price was: $2,590.00.$280.00Current price is: $280.00.
Reviews
There are no reviews yet.