
Buy Sell Trailing Stop loss Tradingview

Original price was: $1,589.00.$259.00Current price is: $259.00.
If you want this indicator then you can pay crypto 239$ (Contact Admin) Click Here
- Original Indicator
- Trading time: Every time
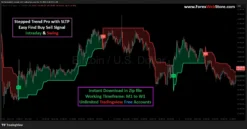
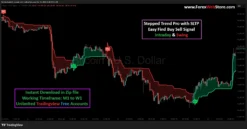
- Instant Download in Zip file
- Working Timeframe: M1 to W1
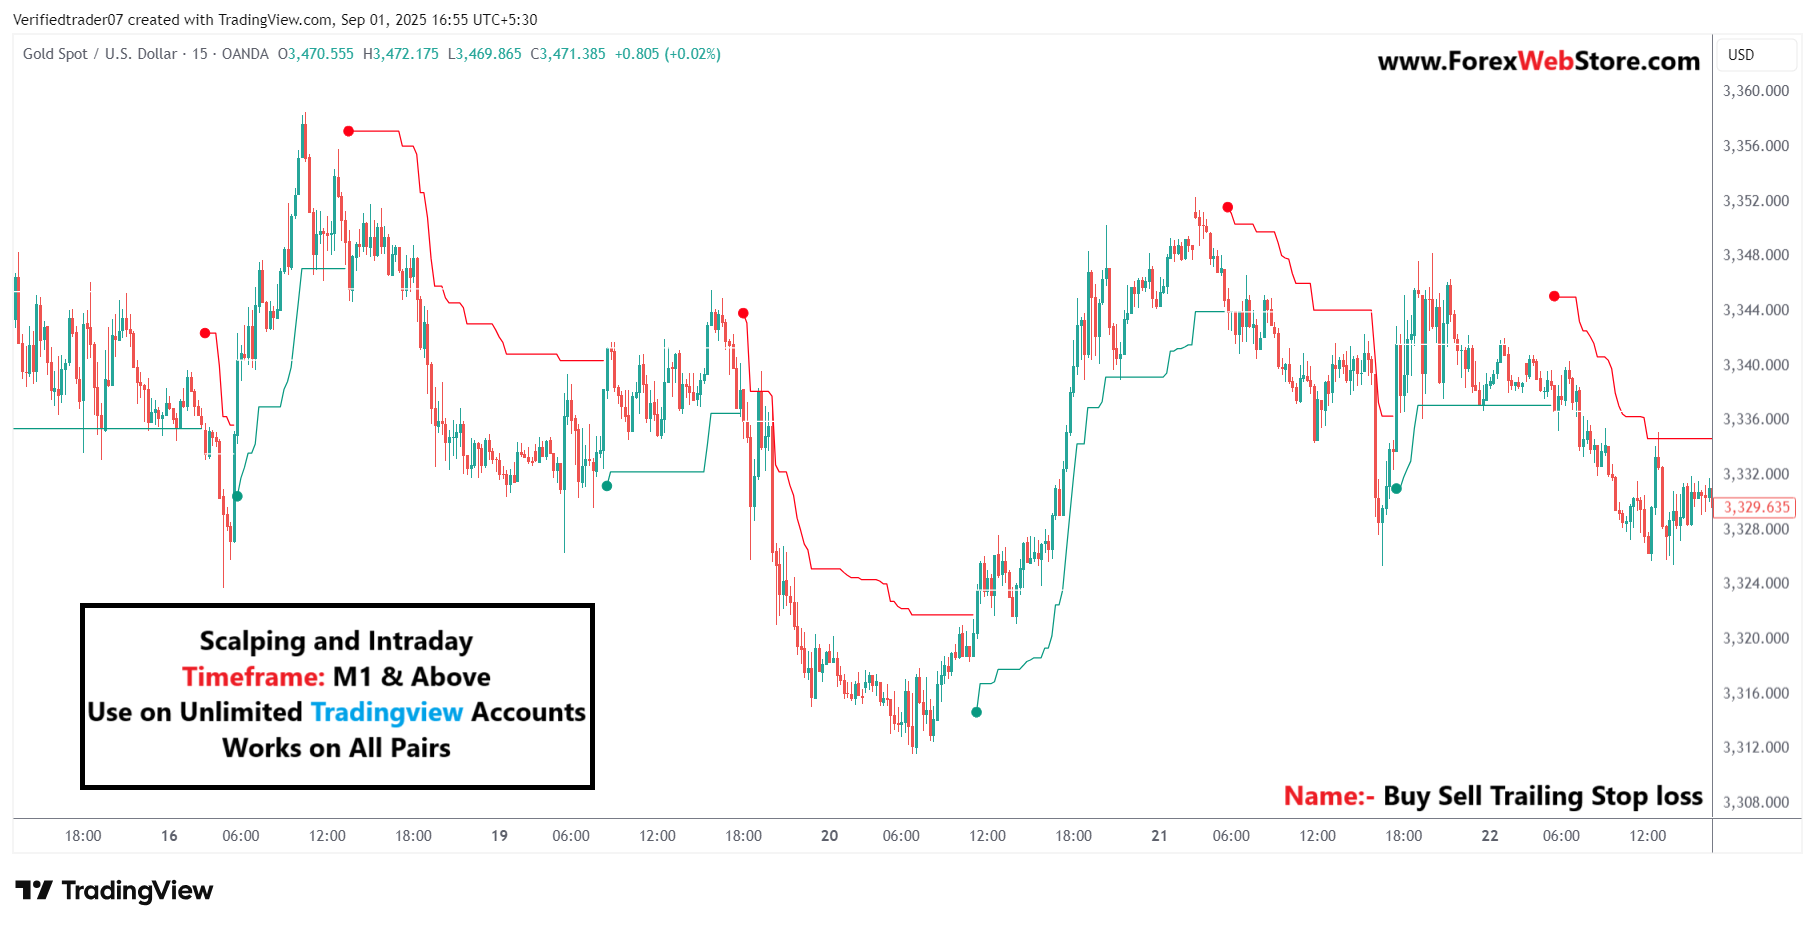
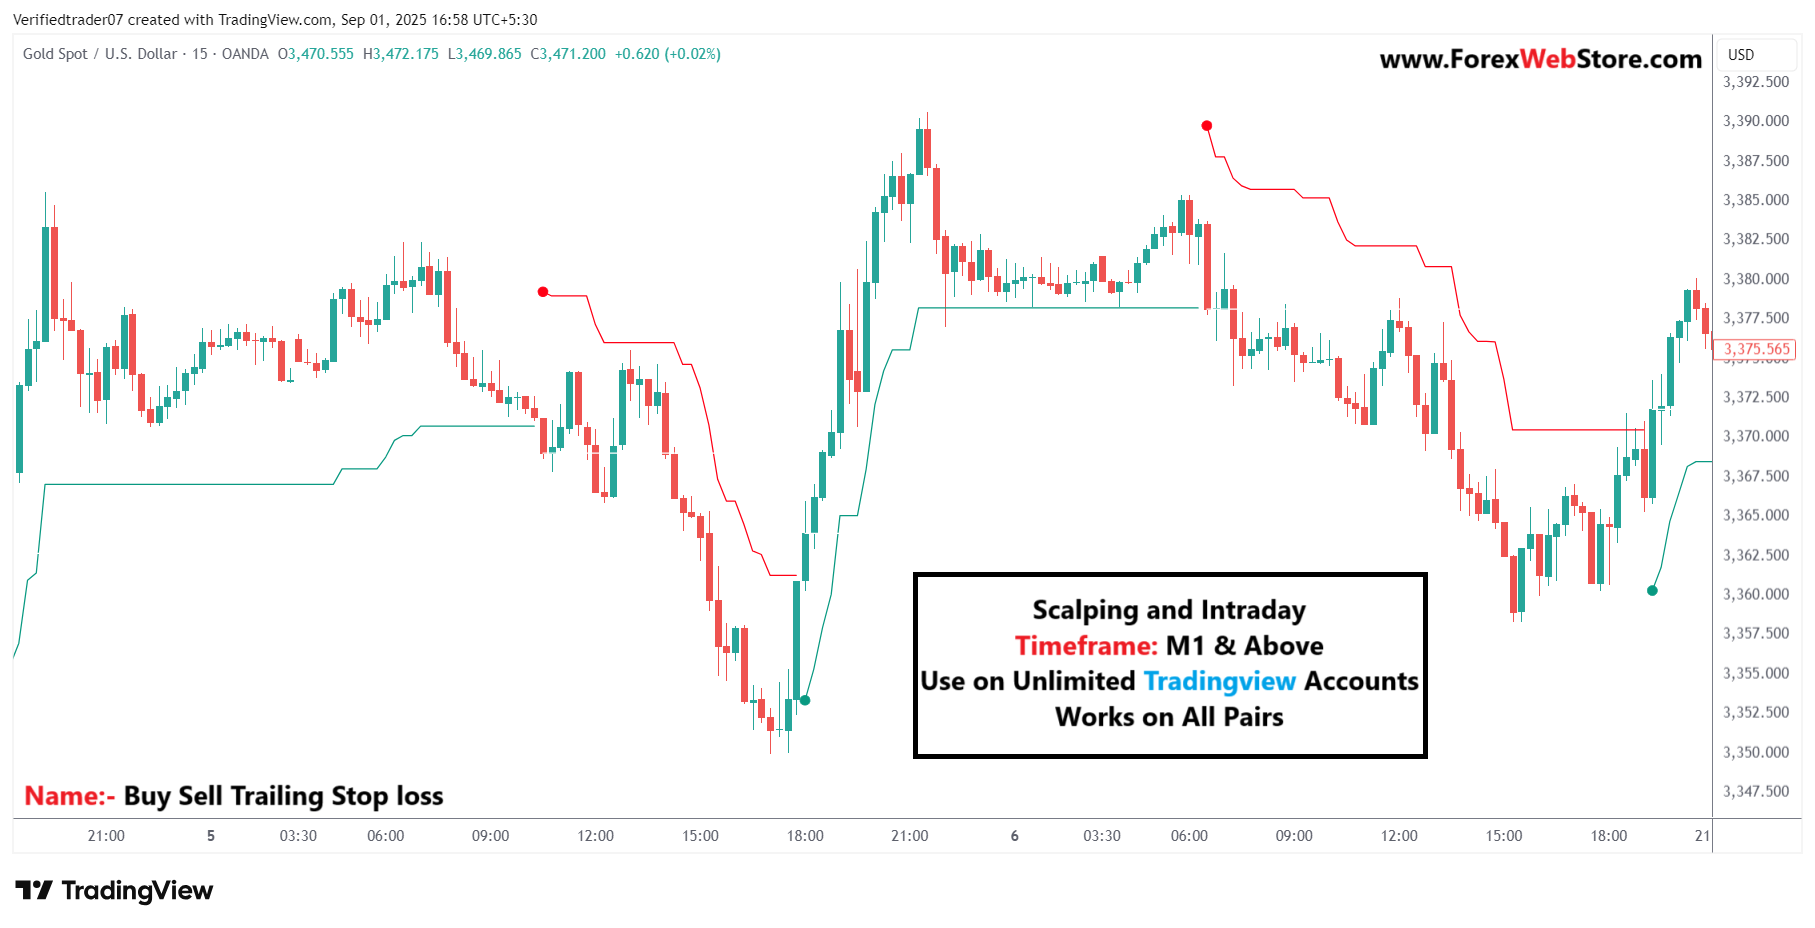
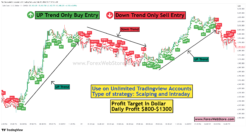
- Use on Unlimited Tradingview Accounts
- Type of strategy: Scalping and Intraday
- Source Code:- Pine script
- Works on All pairs Forex, Crypto, Stock Marke etc.
- Customer Support & Free Upgrades
- Lifetime Version
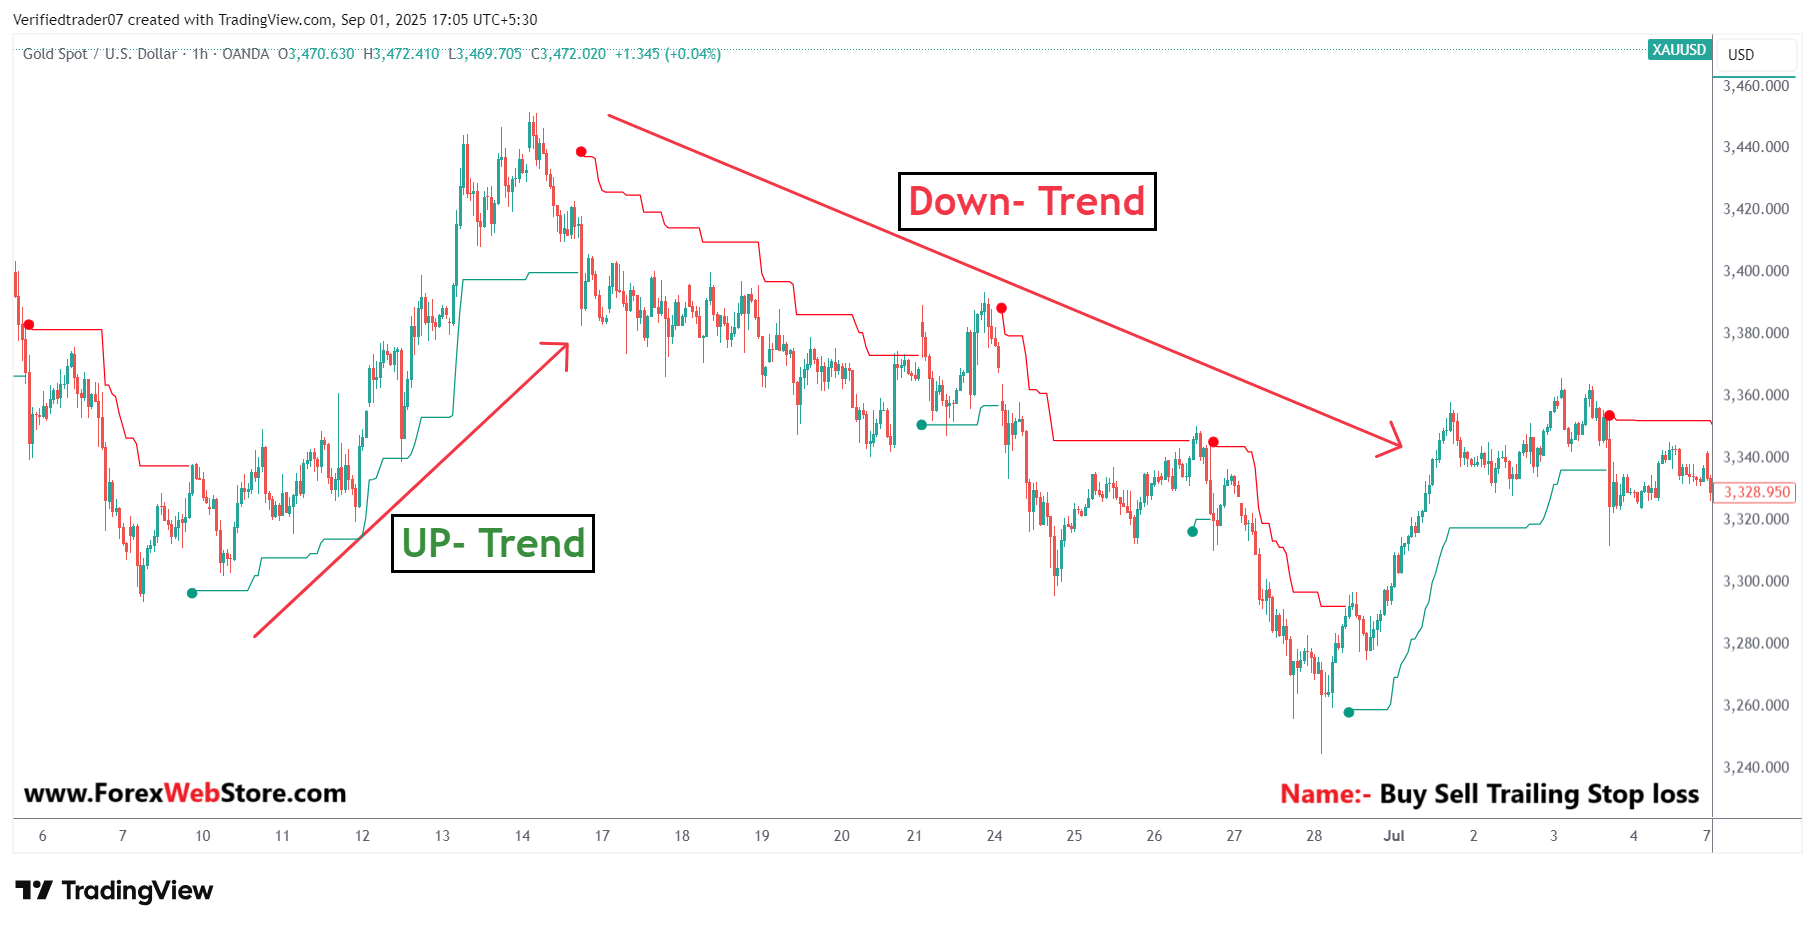
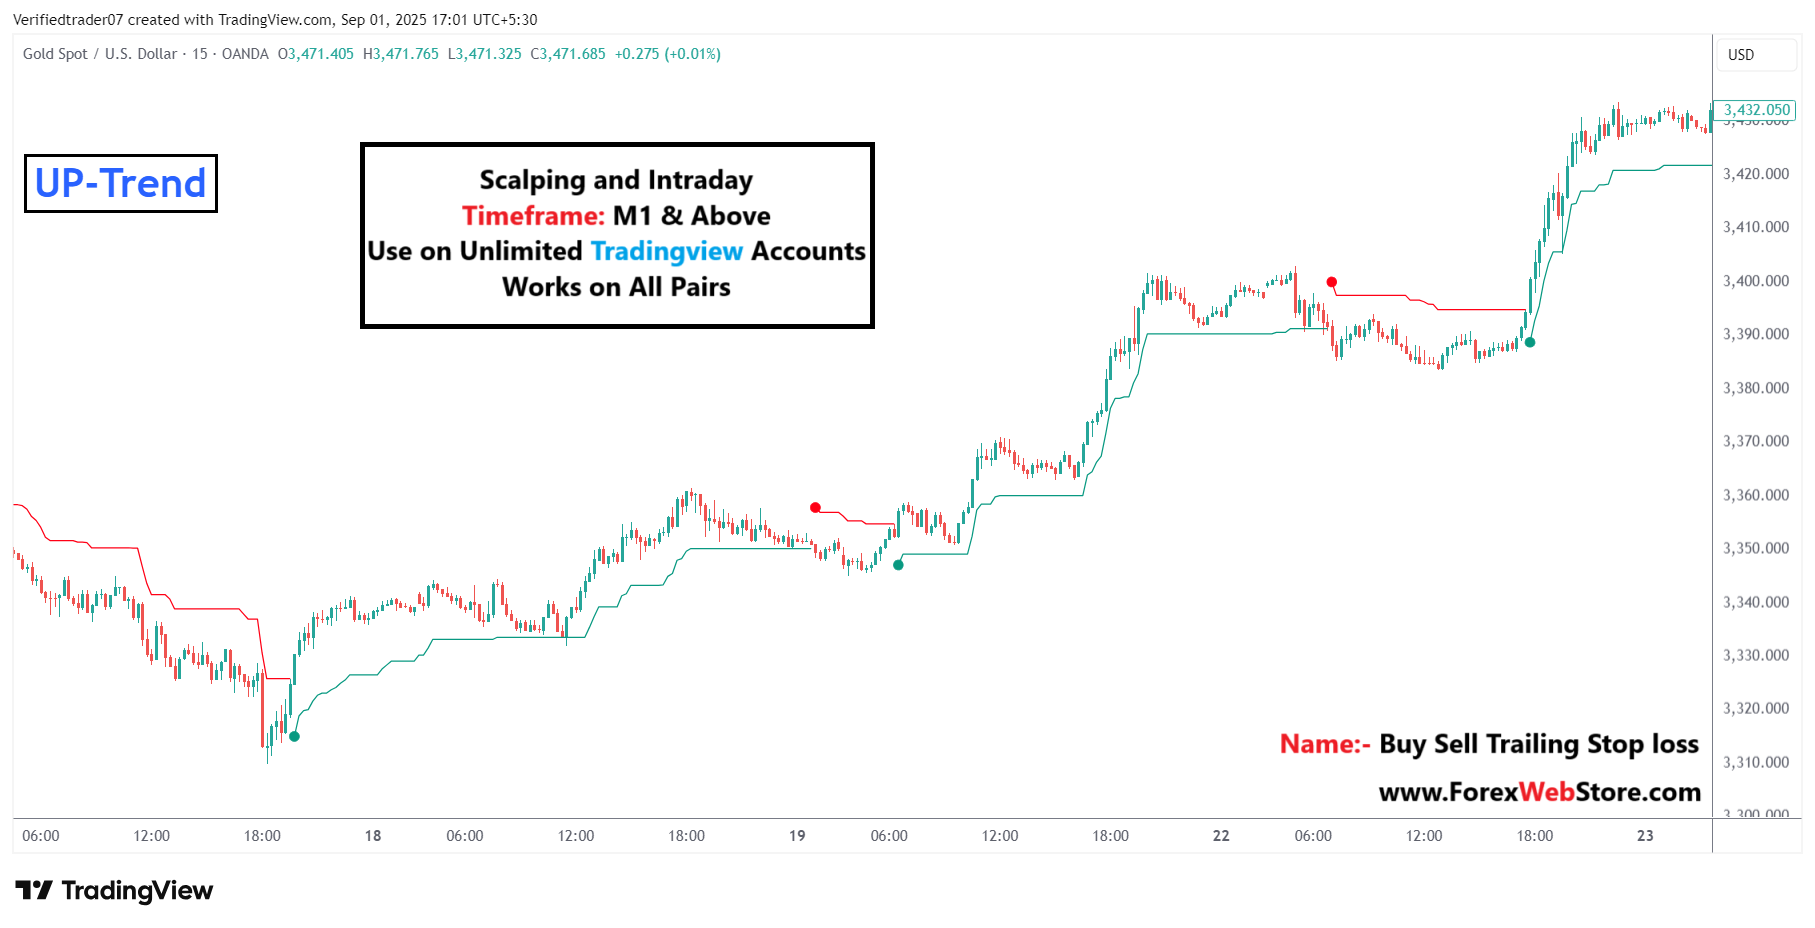
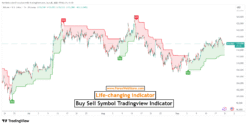
Based on the image you’ve uploaded, here is a breakdown of how the “Buy Sell Trailing Stop Loss” indicator works for entries, stop loss, and take profit.
How to Use the Indicator
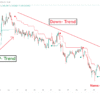
This indicator, as shown on the Gold Spot (XAUUSD) chart, is a trend-following tool designed for scalping and intraday trading (on the M1 timeframe and above). It uses a colored line that changes to signal potential buy and sell opportunities.
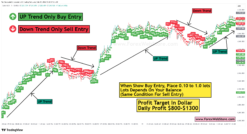
- Green Line/Dots: This indicates an uptrend. The green dot signals a potential buy entry.
- Red Line/Dots: This indicates a downtrend. The red dot signals a potential sell entry.
Buy and Sell Entries
- Buy Entry: Enter a buy trade when the line turns green and a green dot appears below the price candles. The indicator suggests this is where a new uptrend is beginning.
- Sell Entry: Enter a sell trade when the line turns red and a red dot appears above the price candles. This signals the start of a new downtrend.
Stop Loss and Take Profit
The indicator’s name, “Buy Sell Trailing Stop Loss,” is a key clue for how to manage your trades. The colored line itself acts as a dynamic stop loss.
- Stop Loss:
- For a buy trade, you would place your stop loss just below the green line. As the price moves up, the green line will move with it, automatically trailing your stop loss and protecting your profits. If the price falls and crosses below this line, your trade would be exited.
- For a sell trade, you would place your stop loss just above the red line. As the price moves down, the red line will also move, trailing your stop loss and securing your gains. If the price moves back up and crosses above the line, the trade would be closed.
- Take Profit:
- This indicator is primarily designed for a trailing take profit strategy. You would stay in the trade as long as the line color and trend remain in your favor. Your take profit is effectively the point where the line changes color and triggers the trailing stop loss.
- Alternatively, you can use other methods like setting a fixed risk-to-reward ratio (e.g., aiming for a profit that is two or three times the size of your initial stop loss) or exiting at a strong support or resistance level you’ve identified on the chart.

The Golden Rule of Position Sizing
This is the most important aspect of risk management. Position sizing determines how much you invest in a single trade. The standard recommendation is to risk no more than 1% to 2% of your total trading capital per trade.
Let’s use an example with a $500 account:
- Risk per trade: If you choose a 2% risk, you are willing to lose a maximum of 2% of $500, which is $10.
- This means that if you are wrong about a trade and hit your stop loss, the maximum amount you will lose is $10.
- The lot size you use (e.g., 0.01, 0.02) must be calculated to ensure that your stop loss distance in pips or points results in a loss of no more than $10.
This indicator is a great tool for managing risk and capturing full trend moves, especially for shorter-term trading strategies like scalping.
Be the first to review “Buy Sell Trailing Stop loss Tradingview”
You must be logged in to post a review.
Related products

Tradingview
Tradingview
Tradingview
Tradingview


Tradingview

Tradingview
Tradingview
Reviews
There are no reviews yet.