
Free Indicator
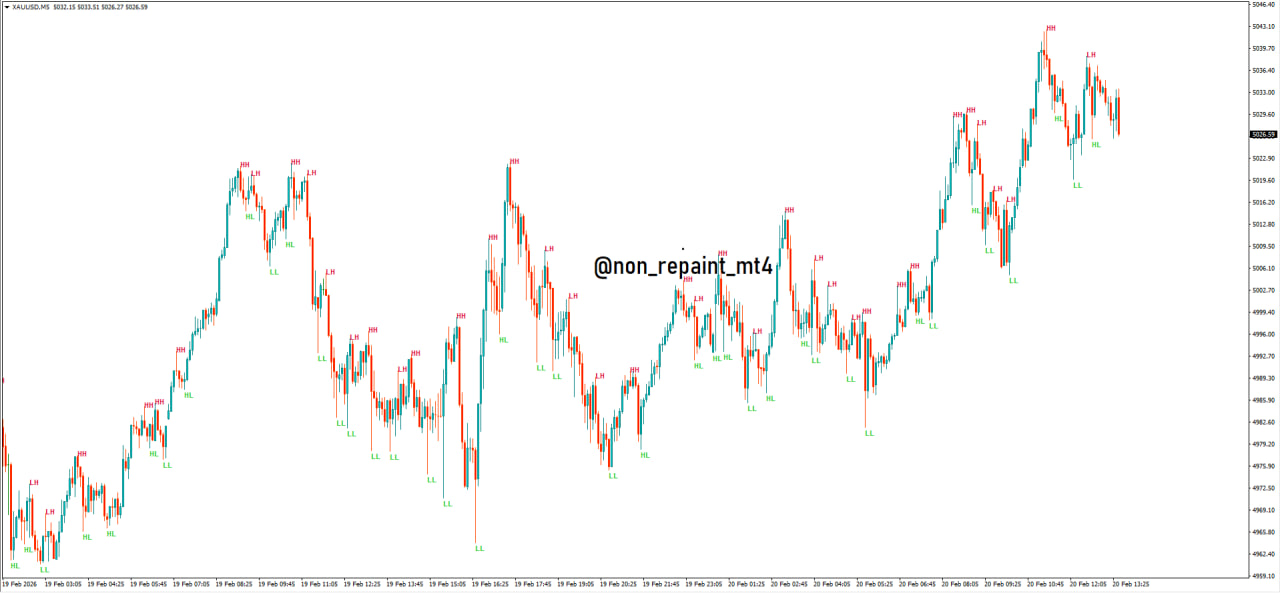
Market structure (HH, HL, LH, LL)
Feb
This indicator is showing market structure using:
- HH = Higher High
- HL = Higher Low
- LH = Lower High
- LL = Lower Low
It helps you trade with the trend instead of guessing reversals.
Now I’ll explain clearly how to use it with Entry, Stop Loss, Take Profit, Risk Management, and how to manage a $500 account.
🔹 Step 1: Understand the Trend
Uptrend Structure:
HH → HL → HH → HL
👉 Look for BUY trades only
Downtrend Structure:
LL → LH → LL → LH
👉 Look for SELL trades only
Never trade against the structure.
✅ BUY Setup (Uptrend)
Conditions:
- Market is making HH and HL
- Price pulls back to form a new HL
- A bullish candle closes from that HL
Entry:
Buy after bullish confirmation from HL.
Stop Loss:
Place SL below the last HL
(Add small buffer)
Take Profit Options:
- Previous HH
- OR Risk:Reward 1:2 minimum
- OR Trail SL after new HH
✅ SELL Setup (Downtrend)
Conditions:
- Market making LL and LH
- Price retraces to LH
- Bearish candle confirmation
Entry:
Sell after bearish confirmation from LH.
Stop Loss:
Place SL above last LH
(Add small buffer)
Take Profit:
- Previous LL
- OR 1:2 Risk Reward
- OR Trail SL after new LL
📊 Risk Management (Very Important)
Golden Rule:
Risk only 1%–2% per trade
For a $500 account:
| Risk % | Risk Amount |
|---|---|
| 1% | $5 |
| 2% | $10 |
👉 Beginners should risk 1% only ($5 per trade)
💰 How to Manage a $500 Account
Safe Trading Plan:
✔ Risk 1% per trade
✔ Minimum 1:2 Risk Reward
✔ Maximum 2 trades per day
✔ Stop trading after 2 losses
✔ No revenge trading
📌 Example Trade (Gold – XAUUSD)
Account: $500
Risk: $5
Stop Loss: 150 points
Take Profit: 300 points
Risk Reward: 1:2
Even with a 40% win rate, you can grow your account if you stay disciplined.
📈 Lot Size Calculation Concept
Before entering:
- Decide your risk ($5)
- Measure SL distance (example 150 points)
- Adjust lot size so that SL hit = $5 loss
Always calculate lot size before entering.
🔥 Pro Tips
Combine this indicator with:
- Support & Resistance
- Higher timeframe trend (H1 / H4)
- London & New York sessions
- Liquidity sweeps
Do not trade in sideways markets.
❌ Common Mistakes
❌ Entering every HH or LL
❌ Ignoring higher timeframe
❌ Moving Stop Loss emotionally
❌ Overtrading
❌ Risking 5–10% per trade
🔥 Simple Formula
Identify trend → Wait for pullback → Confirm structure → Enter → 1:2 RR → Follow discipline.