
-
×
 Buy Sell Gold M1 Tradingview
1 × $280.00
Buy Sell Gold M1 Tradingview
1 × $280.00 -
×
 Stepped Trend Pro with SLTP
1 × $199.00
Stepped Trend Pro with SLTP
1 × $199.00 -
×
 Insanely Accurate Trend Follower
1 × $132.00
Insanely Accurate Trend Follower
1 × $132.00
-93%
Bull Bear Trend & Sentiment Indicator
Original price was: $1,500.00.$99.00Current price is: $99.00.
Professional MT4 Trading Indicator
-
100% Non-Repaint Signals: Confirmed alerts stay fixed on your chart.
-
Multi-Asset Compatible: Works seamlessly on Gold, Forex pairs, and Bitcoin.
-
Easy Setup: Load onto MetaTrader 4 or TradingView in minutes.
-
Real-Time Alerts: Get instant notifications for buy and sell setups.
Note:- Source code is included and will be delivered after purchase.
Bull Bear Trend & Sentiment Indicator
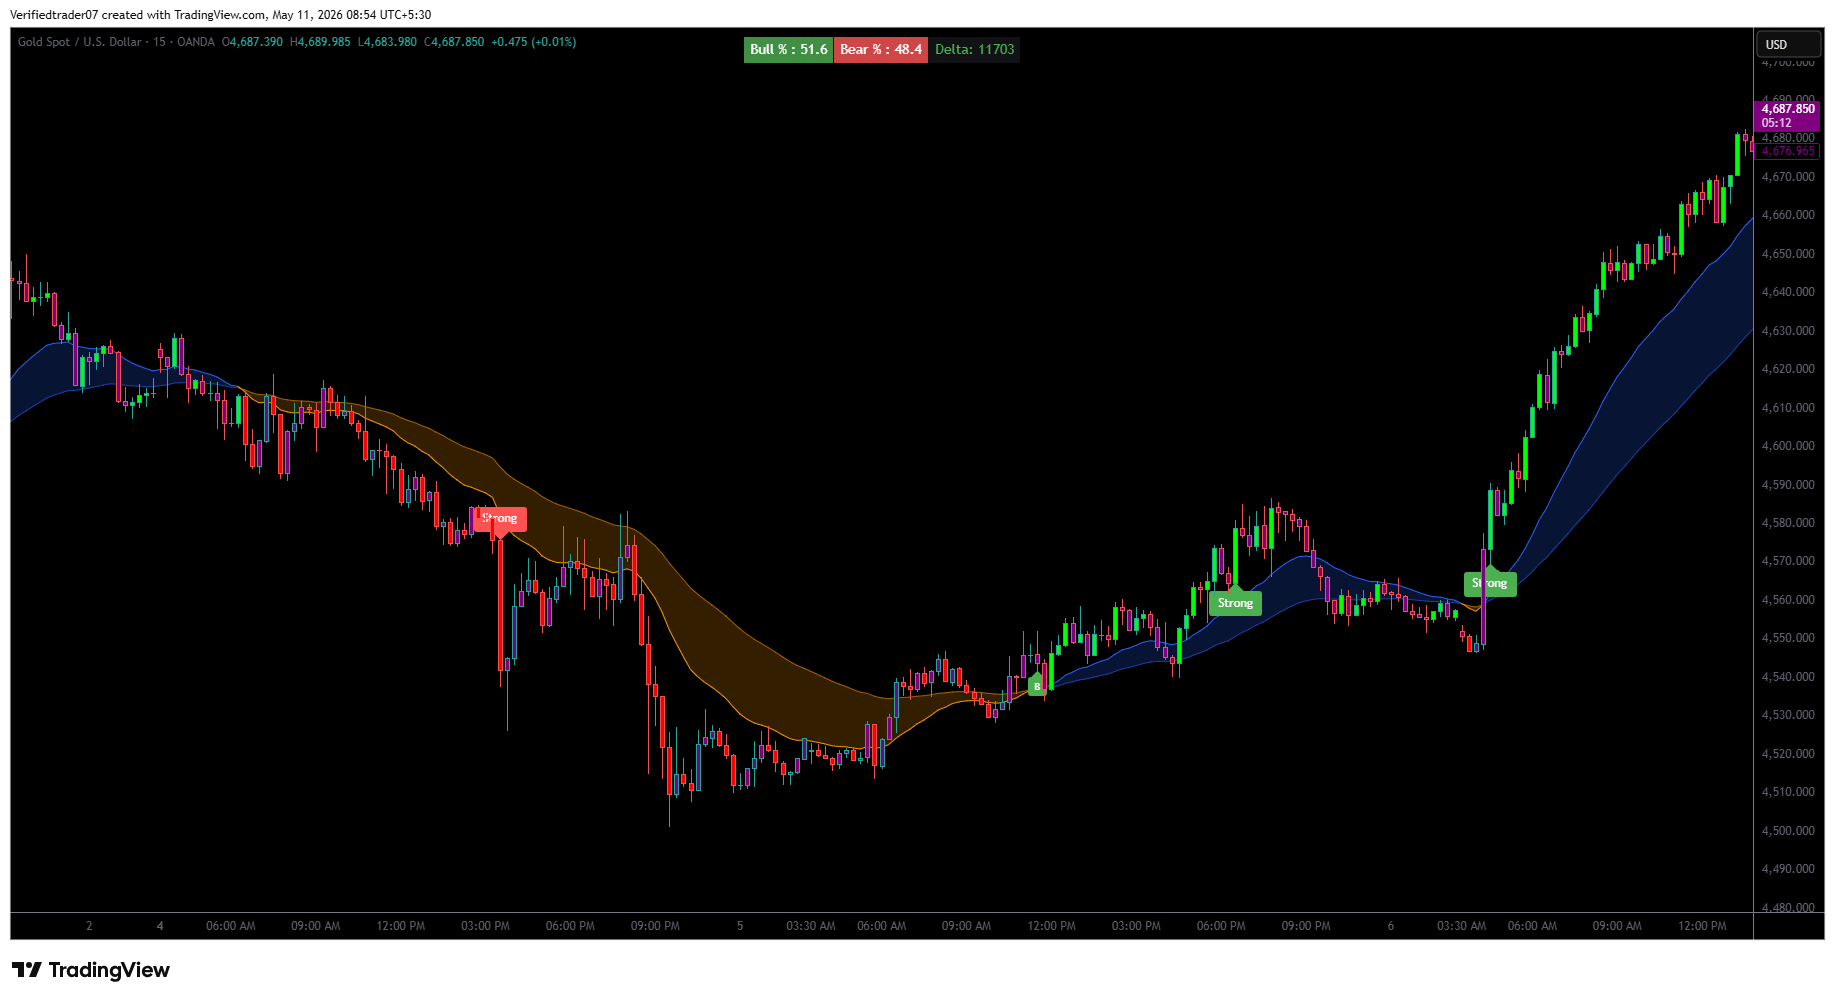
The Dynamic Trend Band & Delta Momentum indicator is designed for TradingView traders who want to catch early trend continuations while avoiding low-probability, choppy range-bound markets. By combining a color-shifting dynamic trend ribbon with real-time volume delta metrics, this tool isolates strong momentum moves in high-volatility assets like Gold (XAUUSD), Forex pairs, and Cryptocurrencies.
How It Works
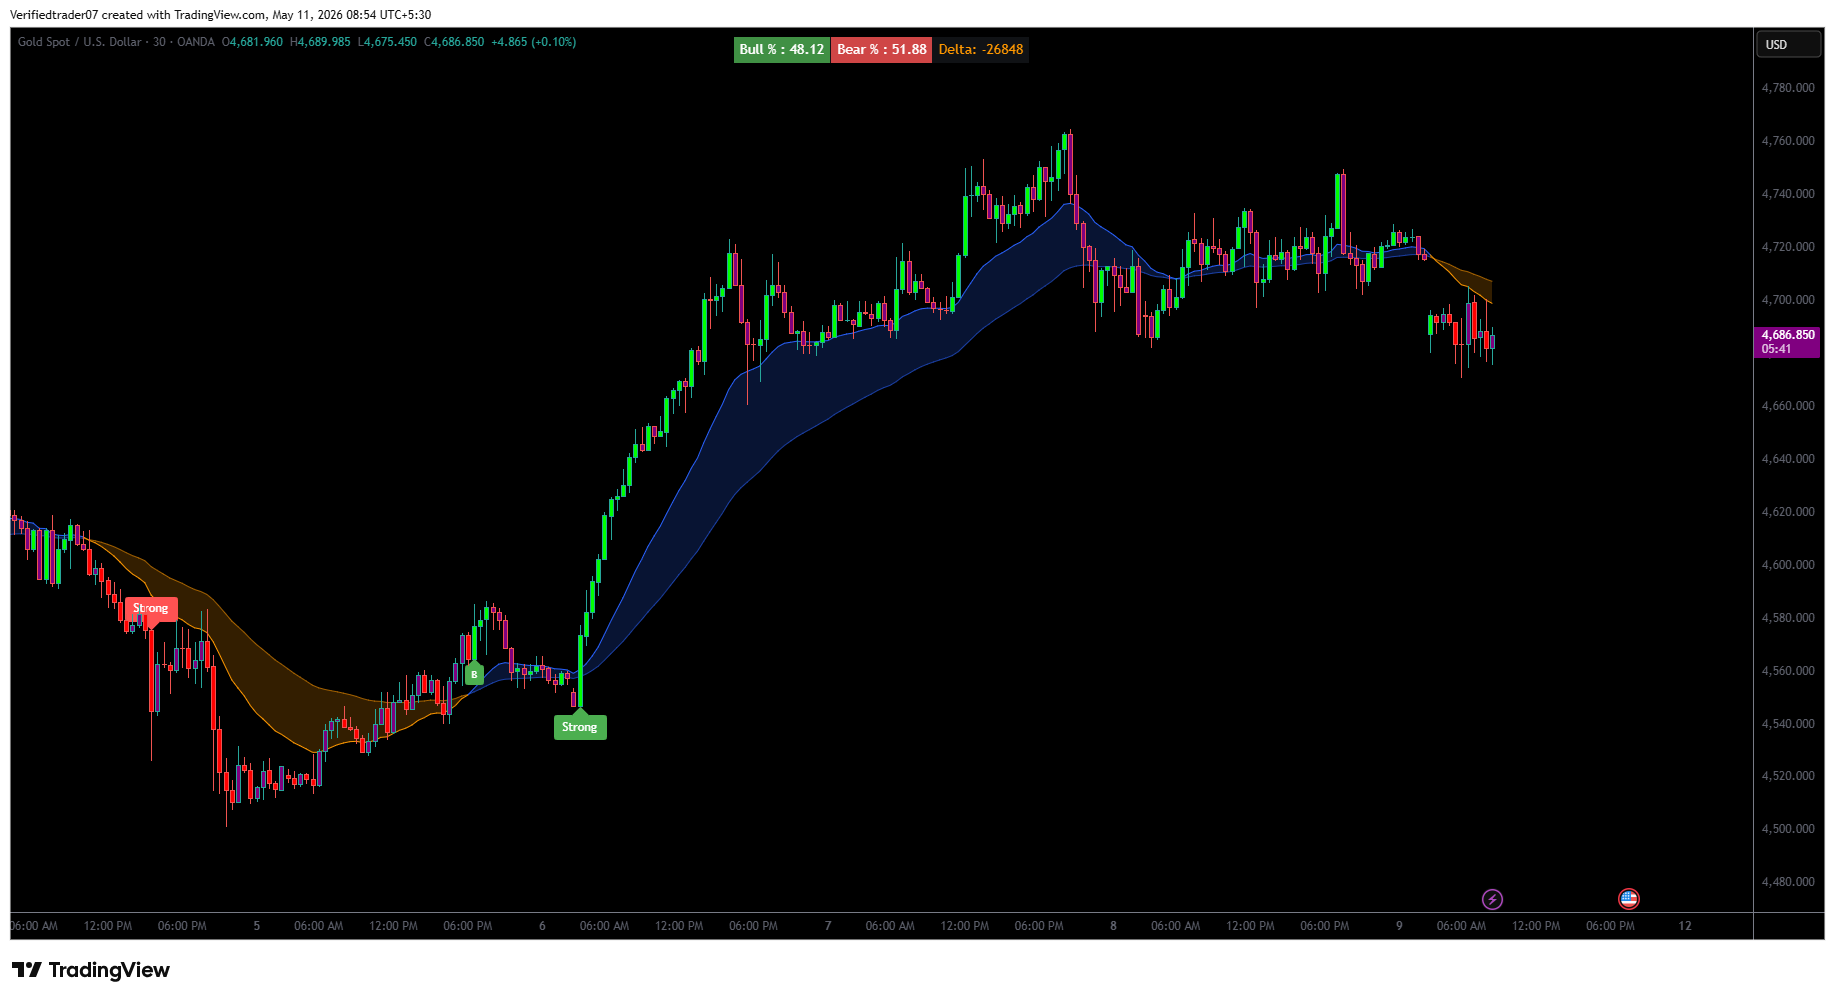
The indicator uses a combination of dynamic trend tracking and volume sentiment:
-
Dynamic Trend Band (Ribbon):
-
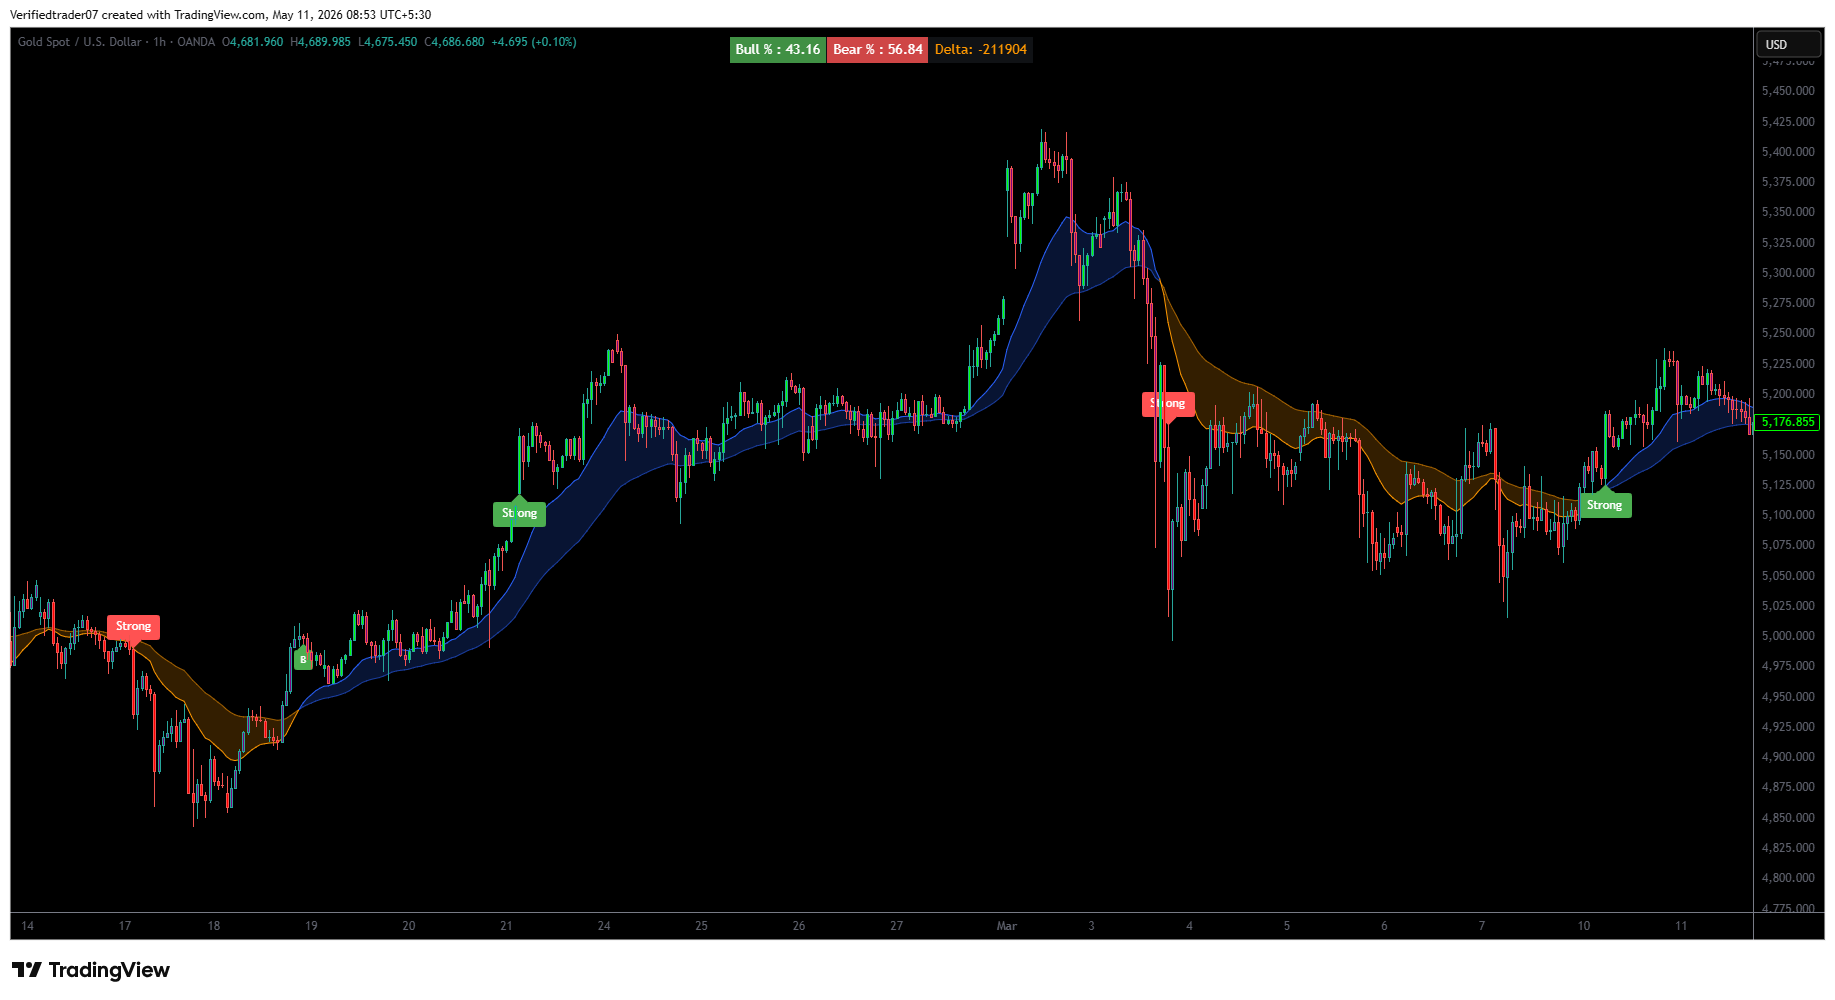
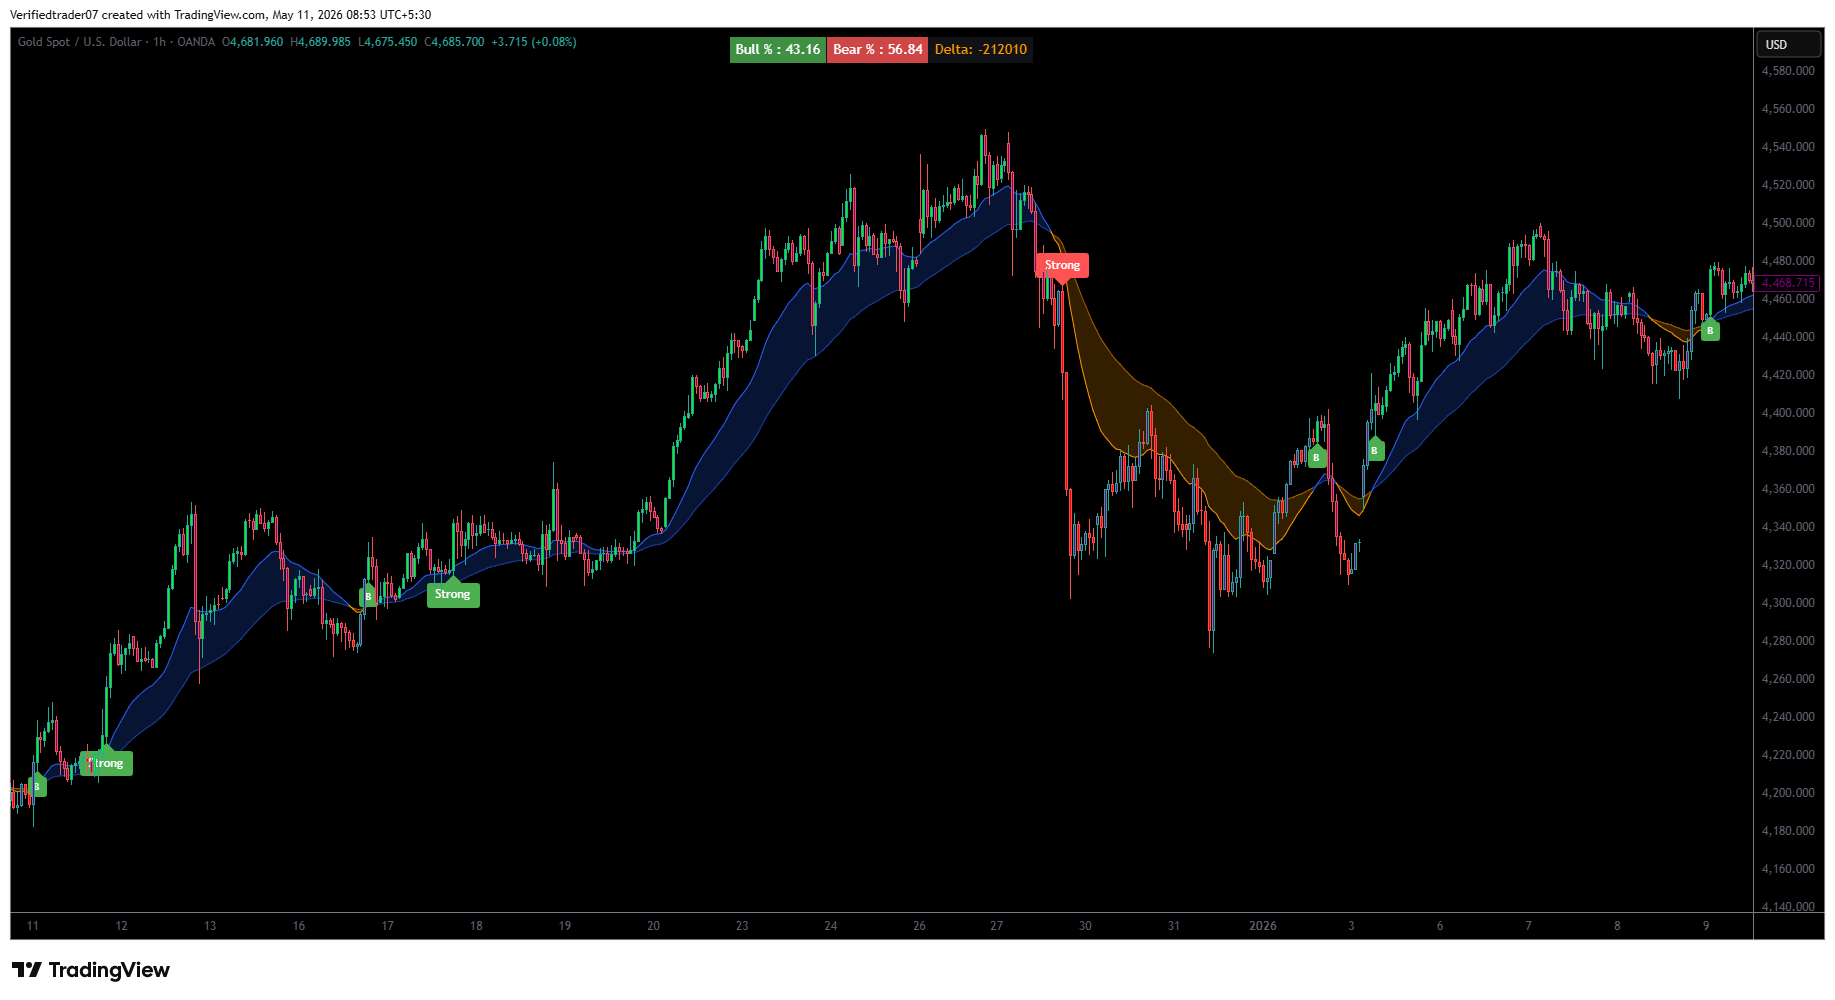
Blue Ribbon: Signals a macro Bullish Trend. Price is trading above supportive trend bands.
-
Orange Ribbon: Signals a macro Bearish Trend. Price is trading below resistive trend bands.
-
-
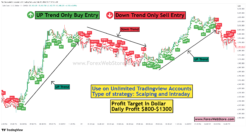
Buy Signals (🟩 Green Labels):
-
“B” Label: Standard buy/re-entry setup during an active uptrend.
-
“Strong” Label: High-confluence buy entry backed by strong bullish volume and momentum expansion.
-
-
Sell Signals (🟥 Red Labels):
-
“Strong” / “S” Label: High-probability sell entry indicating institutional selling pressure and trend reversal.
-
-
Top Metric Bar (Bull % / Bear % / Delta):
-
Displays live market control metrics: Bull % vs. Bear % and net Volume Delta. This gives you an instant snapshot of market sentiment before placing a trade.
-
How to Trade the M1 Timeframe (Step-by-Step)
Trading the 1-Minute (M1) chart with this indicator requires fast execution aligned with the ribbon color and delta momentum.
M1 Buy Setup
-
Ribbon & Delta Check: Ensure the Dynamic Trend Band is Blue and the top metric shows strong Bull % or positive Delta.
-
Signal: Wait for a green “Strong” or “B” label to print below a closed candle.
-
Execution: Enter a BUY order at the open of the next candle.
M1 Sell Setup
-
Ribbon & Delta Check: Ensure the Dynamic Trend Band is Orange and the top metric shows dominant Bear % or negative Delta.
-
Signal: Wait for a red “Strong” label to print above a closed candle.
-
Execution: Enter a SELL order at the open of the next candle.
Risk Management: Stop Loss & Take Profit Rules
Stop Loss (SL) Placement
-
For Buy Trades: Place your Stop Loss 3 to 5 pips below the lower boundary of the Blue Ribbon (or beneath the recent swing low).
-
For Sell Trades: Place your Stop Loss 3 to 5 pips above the upper boundary of the Orange Ribbon (or above the recent swing high).
Take Profit (TP) Options
-
Fixed Risk-to-Reward Ratio: Target a 1:1.5 or 1:2 Risk-to-Reward Ratio.
-
Ribbon Flip Exit: Hold the position as long as the price stays on the active side of the ribbon; close the trade if the ribbon shifts color or if price closes inside the band.
-
Opposite Signal Exit: Exit immediately if an opposing signal label appears.
Pro Tips for Higher Accuracy
-
Follow the Ribbon Color: Avoid taking Buy signals when the ribbon is Orange, and avoid Sell signals when the ribbon is Blue.
-
Confirm with Delta: Look for confirmation from the top header metric—if you see a Buy signal but the Bear % is high, wait for better alignment.
-
Ride Long Trends: The dynamic ribbon acts as a trailing support/resistance level, making it easy to trail your stop loss during strong trending market conditions.
Be the first to review “Bull Bear Trend & Sentiment Indicator”
Related products
-89%
-88%

Tradingview
Original price was: $3,999.00.$480.00Current price is: $480.00.
-75%
Tradingview
Original price was: $3,999.00.$999.00Current price is: $999.00.
-92%
Tradingview
Original price was: $1,999.00.$150.00Current price is: $150.00.
-97%
Tradingview
Original price was: $3,999.00.$136.00Current price is: $136.00.
-95%
Tradingview
Original price was: $4,782.00.$250.00Current price is: $250.00.
-99%
Tradingview
Original price was: $20,000.00.$180.00Current price is: $180.00.
-89%
Tradingview
Original price was: $2,590.00.$280.00Current price is: $280.00.
Reviews
There are no reviews yet.