
-
×
 Buy Sell SuperTrend Version 2
1 × $250.00
Buy Sell SuperTrend Version 2
1 × $250.00
-94%
Buy Sell Symbol Tradingview Indicator


Original price was: $3,999.00.$250.00Current price is: $250.00.
If you want this indicator then you can pay crypto $239 (Contact Admin) Click Here
- Original Indicator
- Trading time: Every time
- Instant Download in Zip file
- Working Timeframe: M1 to W1
- Use on Unlimited Tradingview Accounts
- Type of strategy: Scalping and Intraday
- Source Code:- Pine script
- Works on All pairs Forex, Crypto, Stock Marke etc.
- Customer Support & Free Upgrades
- Lifetime Version
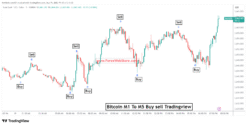
Based on the image you’ve uploaded, here is a breakdown of how the indicator works and how you might use it for buy and sell entries, along with where to place your stop loss and take profit.
Indicator Explained
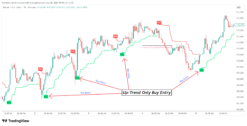
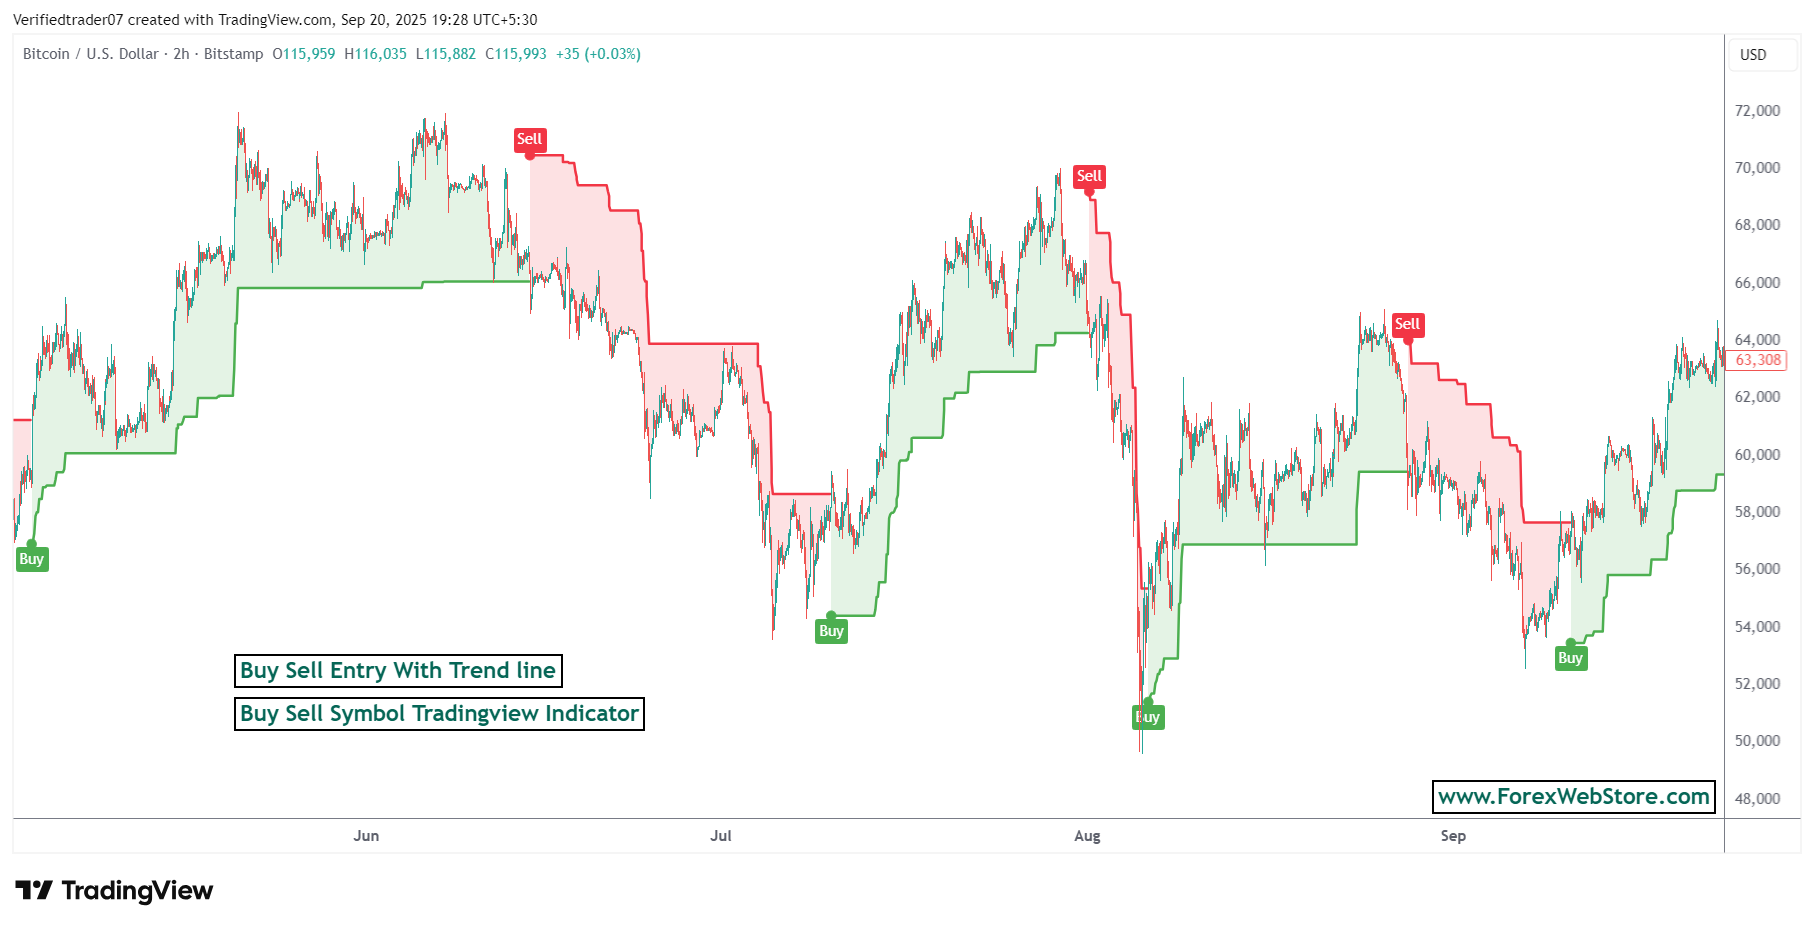
The image shows a Bitcoin (BTC) chart with an indicator that uses colored lines and “Buy” and “Sell” signals.
- Green Line/Area: This suggests an uptrend. The indicator signals “Buy” and the price is above this green line.
- Red Line/Area: This suggests a downtrend. The indicator signals “Sell” and the price is below this red line.
- “Buy” Signal: A green “Buy” label appears when the trend changes from red to green, indicating a potential entry for a long position.
- “Sell” Signal: A red “Sell” label appears when the trend changes from green to red, indicating a potential entry for a short position.
Buy and Sell Entries
- Buy Entry: You would consider buying when the indicator gives a “Buy” signal. This is when the line turns green and a “Buy” label appears.
- Sell Entry: You would consider selling (or shorting) when the indicator gives a “Sell” signal. This is when the line turns red and a “Sell” label appears.
Stop Loss and Take Profit
This indicator doesn’t explicitly show where to place your stop loss or take profit. However, traders often use the indicator’s lines and previous price action to set these levels.
- Stop Loss (for a Buy Trade): A common strategy is to place your stop loss just below the green support line or below a recent low. The idea is that if the price breaks below this support line, the trend may be reversing, and your initial trade idea is likely wrong. For example, if you bought in late August, you would place your stop loss just below the green line.
- Stop Loss (for a Sell Trade): Similarly, for a sell trade, you would place your stop loss just above the red resistance line or above a recent high. If the price moves above this resistance, the trend may be changing. For example, if you sold in early June, you would place your stop loss just above the red line.
- Take Profit: Take profit levels are more subjective and depend on your trading strategy. You have a few options:
- Trailing Stop: You can use the indicator’s line as a trailing stop. For a buy trade, you would close the position when the price breaks below the green line. For a sell trade, you would close the position when the price breaks above the red line. This allows you to stay in the trade for the entire trend.
- Fixed Risk/Reward: You can set a fixed risk/reward ratio, for example, aiming for a profit that is twice the size of your stop loss.
- Key Resistance/Support Levels: You can also identify previous highs (for a buy trade) or lows (for a sell trade) as potential take profit targets.

In short, the indicator helps you find entries based on trend direction, while a good stop loss and take profit strategy requires using other technical analysis techniques alongside it. Remember to always use a stop loss to manage your risk.
Be the first to review “Buy Sell Symbol Tradingview Indicator”
You must be logged in to post a review.
Related products
-84%
Tradingview
Original price was: $1,589.00.$259.00Current price is: $259.00.
-59%

Original price was: $879.00.$359.00Current price is: $359.00.
-85%


Tradingview
Original price was: $1,999.00.$299.00Current price is: $299.00.
-82%
Tradingview
Original price was: $1,999.00.$350.00Current price is: $350.00.
-94%
Tradingview
Original price was: $3,999.00.$250.00Current price is: $250.00.
-91%
Tradingview
Original price was: $3,999.00.$359.00Current price is: $359.00.
-71%


Original price was: $871.00.$249.00Current price is: $249.00.
-94%


Tradingview
Original price was: $3,958.00.$250.00Current price is: $250.00.
Reviews
There are no reviews yet.