
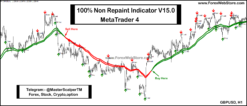
 Super Long Trend Indicator | 100% Non Repaint Indicator V14.0
Buy side & Sell side Liquidity MT4 Indicator


Original price was: $1,999.00.$429.00Current price is: $429.00.
- Original Indicator
- 100% Non-Repaint
- Trading time: Every time
- Instant Download in Zip file
- Arrows Popup Sound Alerts
- Timeframe: M15, M30, H1,H4,D1
- Never repaint any trading signal, 100% guaranteed
- Use on unlimited MT4 accounts
- Type of strategy: Powerful Scalping Indicator
- Built for Metatrader 4 (MT4 for PC and Laptop, MT4 for MAC)
- Works on Forex (all pairs), Commodities, Stocks, Metals, Gold…
- Recommended Broker ECN
- Pay Once and Use it for a Lifetime
- Customer Support & Free Upgrades For Life Time
Buy Side & Sell Side Liquidity MT4 Indicator
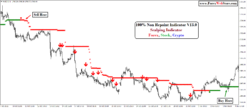
In this indicator illustrates a trading strategy centered on Liquidity Sweeps, a concept popular in Inner Circle Trader (ICT) and Smart Money Concepts (SMC) methodologies. Rather than a single automated indicator, it represents a price action framework based on finding where stop losses are clustered.
The objective of the strategy is to look for a short position when the price reaches the previous day’s high, or to look for a long position when the price reaches the previous day’s low. Profit taking will be the opposite place, ie if we take a short position, we will take profit at the previous day’s low and vice versa.
What You Get for Your Metatrader 4:-
- Professional trading systems for all markets and time frames
- 100 Non-repainting and non-lagging indicators with dashboards
- Accurate buy and sell signals with arrows and alerts
- Dynamic take profit levels to maximize your gains Smart stop loss levels to protect your capital
- Buy/Sell Automatic Signals
- Pop-up alerts
- Sound alerts
- Email alerts
- Push notifications
- Quick and easy installation with user-friendly interface
- Exclusive access to our community support portal Interactive multilingual guides and tips with FAQs
- Free updates to new versions and features
- First-class support with quick responses
- Instant download after purchase
The Core Concept: Liquidity
In this framework, “Liquidity” refers to areas where many retail traders have placed their Stop Losses.
-
Buyside Liquidity (BSL): Located above old highs. These are the stop losses of short sellers (buy-to-close orders).
-
Sellside Liquidity (SSL): Located below old lows. These are the stop losses of buyers (sell-to-close orders).
The theory is that “Smart Money” (banks/institutions) pushes price into these zones to trigger those stops, providing the necessary volume for them to enter their own large positions.
How to Take Entries
The strategy doesn’t enter just because price touches a line; it enters after price “sweeps” the line and reverses.
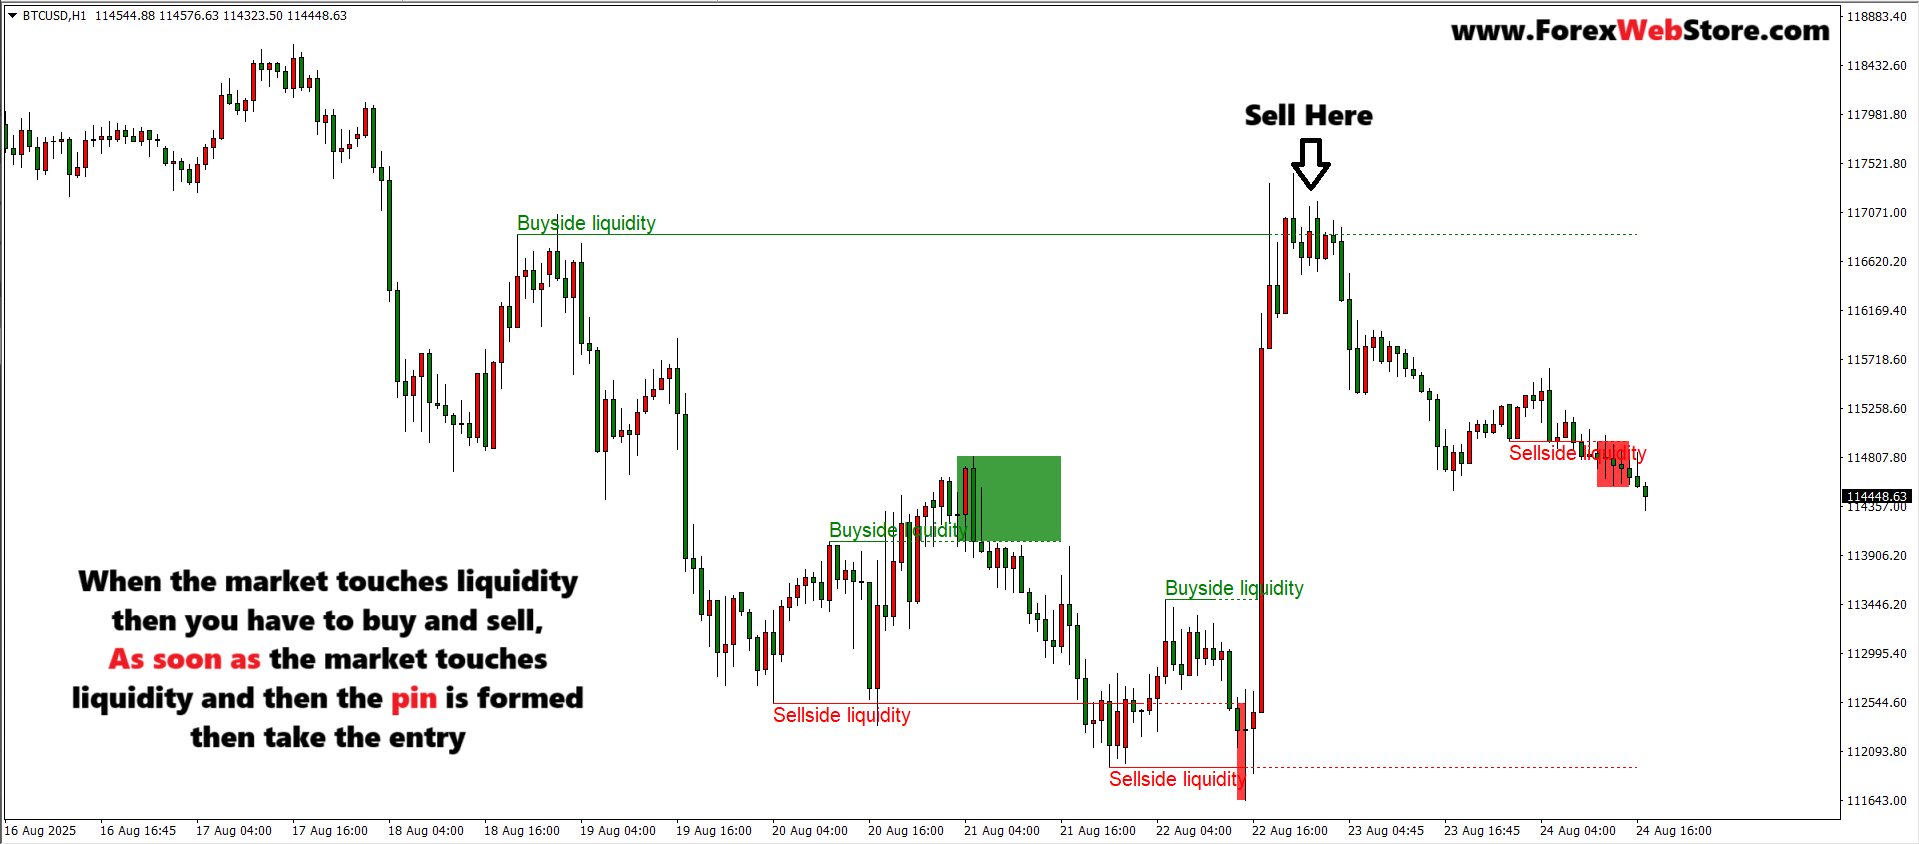
1. The Sell Entry (Bearish Reversal)
-
Identify: Look for a prominent “swing high” (Buyside Liquidity).
-
The Sweep: Price moves above that high, triggering buy stops.
-
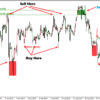
The Confirmation: Price fails to stay above the high and quickly closes back below it (often forming a “wick” or a “Stop Hunt”).
-
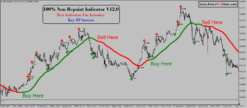
Entry: Sell when price breaks back below the old high or after a bearish engulfing candle in the “Sell Zone Area.”
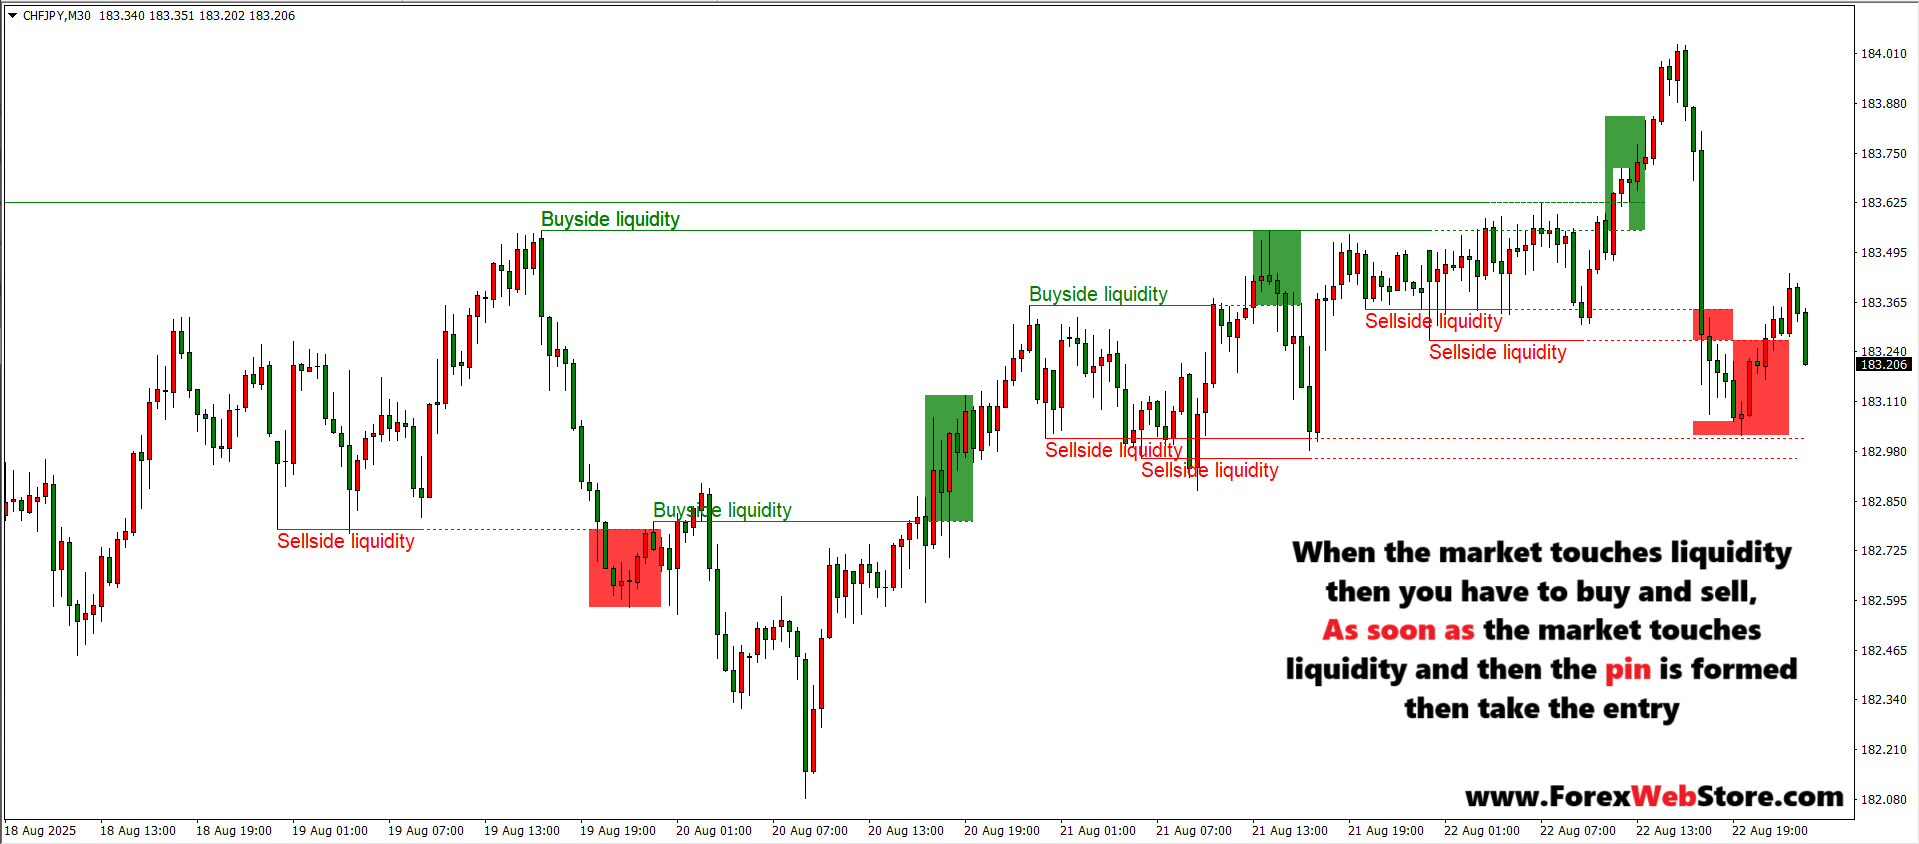
2. The Buy Entry (Bullish Reversal)
-
Identify: Look for a prominent “swing low” (Sellside Liquidity).
-
The Sweep: Price dips below the low, triggering sell stops.
-
The Confirmation: Look for a sharp rejection. Price should not trend lower; it should “grab” the liquidity and snap back up.
-
Entry: Buy as price recovers above the previous low level (the red boxes in your image).
Stop Loss & Risk Management
Trading liquidity sweeps is high-reward but requires strict discipline because you are essentially “fading” the immediate momentum.
| Component | Guideline |
| Stop Loss (SL) | Place your SL just above the “Stop Hunt” candle’s wick (for sells) or below the “Sweep” wick (for buys). If price continues past that wick, the setup is invalidated. |
| Take Profit (TP) | Target the opposite liquidity. If you buy at a Sellside Liquidity sweep, your first target is the nearest Buyside Liquidity (the recent high). |
| Risk-to-Reward | Aim for a minimum of 1:2 or 1:3. Because your SL is tight (just past the wick), these setups often offer very high RR. |
| Position Sizing | Never risk more than 1% of your account per trade. These “sweeps” can sometimes turn into full breakouts, so you must be okay with being stopped out. |
Pro-Tips for Accuracy
-
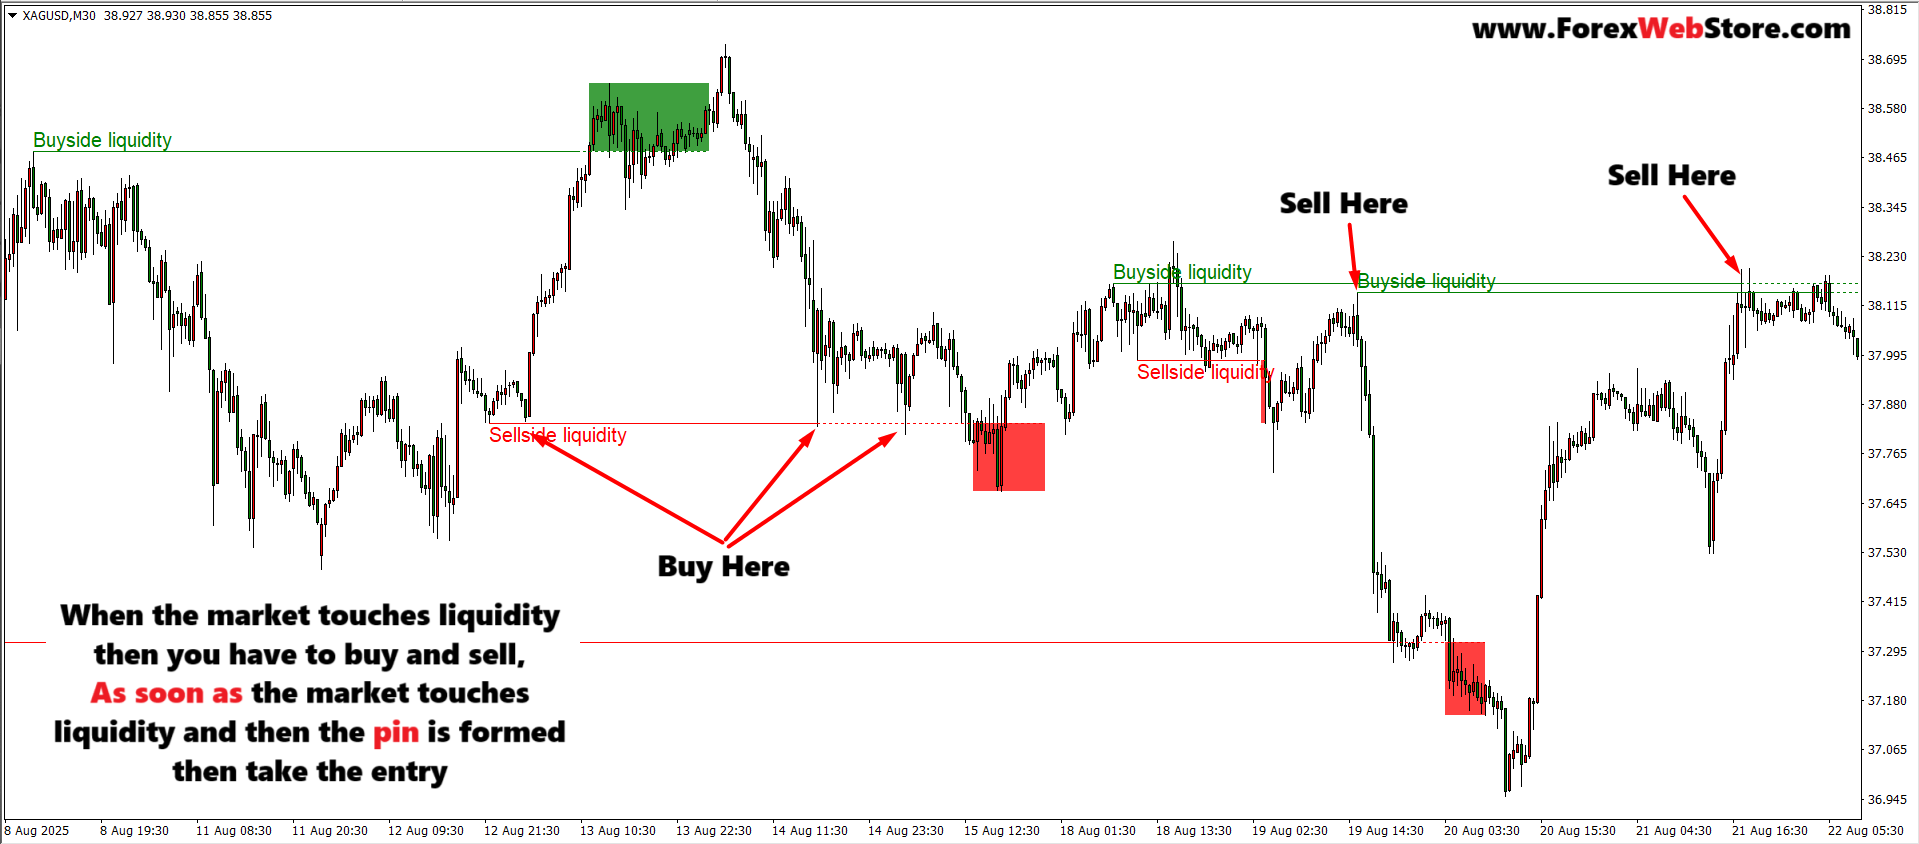
Timeframes: The image shows an H1 (1-Hour) chart. This is a “sweet spot” timeframe. For better entries, find the sweep on the H1, then drop down to the M5 (5-Minute) chart to find a “Market Structure Shift” before entering.
-
The “Trap”: Be careful—if price hits a liquidity level and consolidates (moves sideways) instead of rejecting sharply, it might be preparing for a real breakout rather than a reversal.
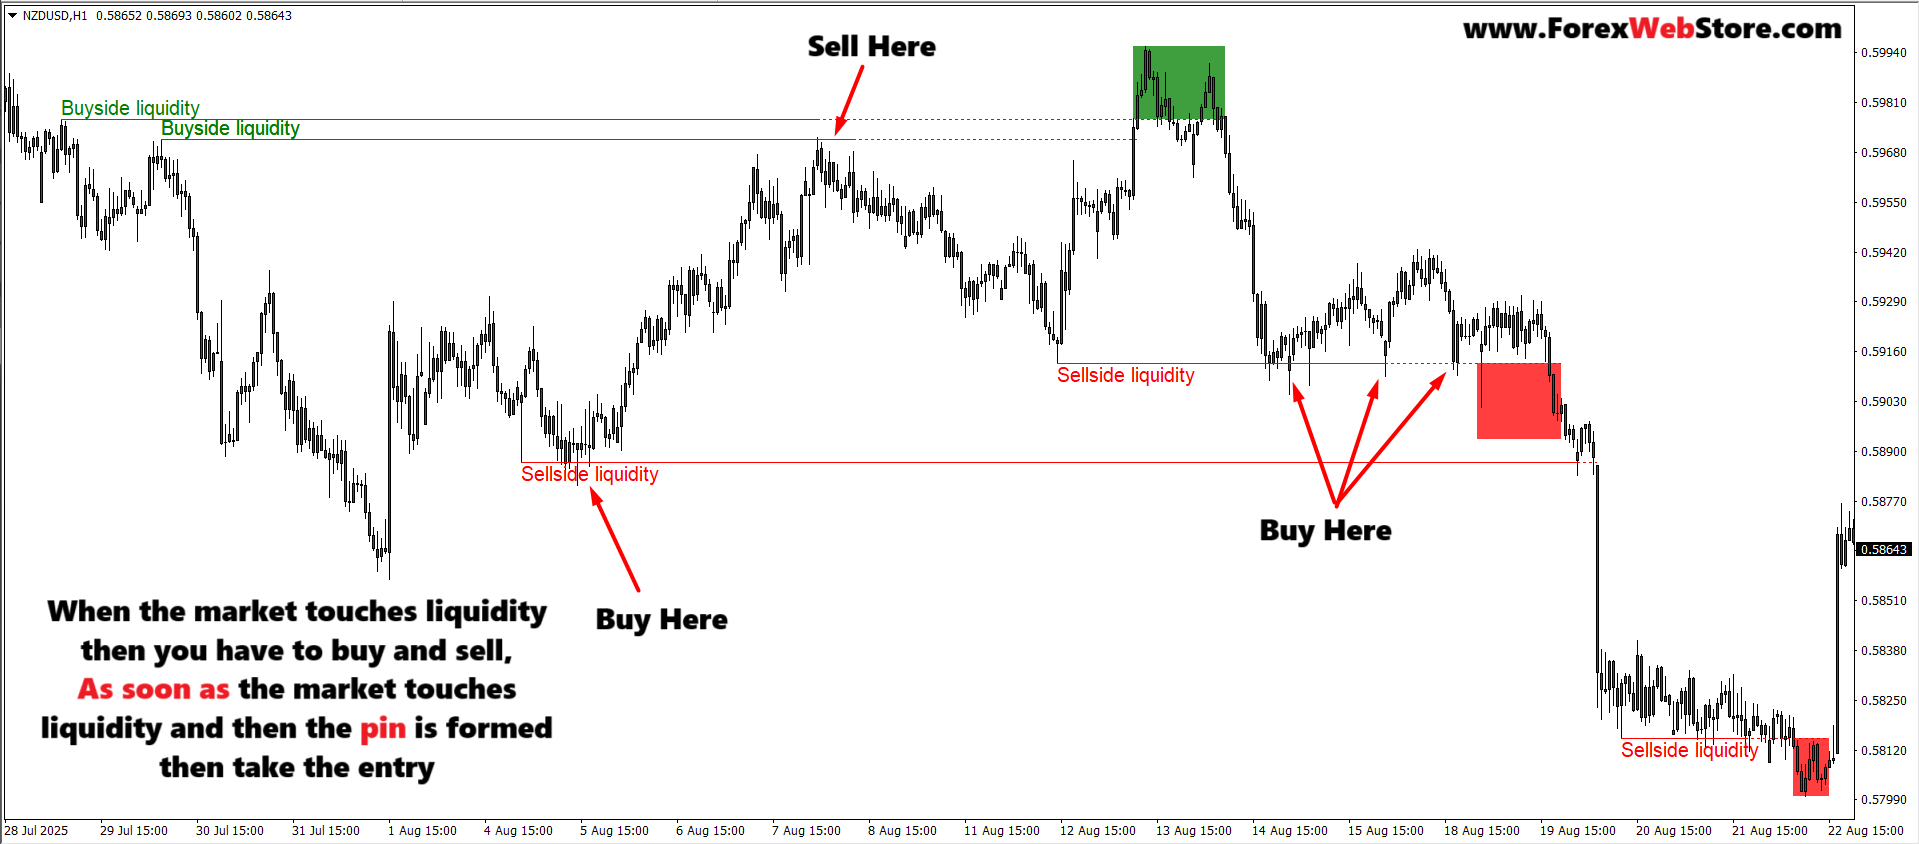
The indicator visually marks two key types of zones: Buyside Liquidity (typically above highs) and Sellside Liquidity (below lows). These zones suggest where stop-loss orders, breakout traders, or trapped positions might accumulate. When price approaches or sweeps these areas, it often signals potential reversals, fakeouts, or momentum breakouts.
Traders can use this to:
- Anticipate potential price reversals at liquidity grabs
- Identify areas of liquidity inducement
- Align entries and exits with institutional footprints
- Avoid entering near obvious retail stop zones
Category: ICT – Liquidity – Smart Money
![]() Platform: MetaTrader 4 (MT4)
Platform: MetaTrader 4 (MT4)
![]() Skill Level: Intermediate
Skill Level: Intermediate
![]() Indicator Type: Reversal – Continuation
Indicator Type: Reversal – Continuation
![]() Timeframes: Multi-Timeframe
Timeframes: Multi-Timeframe
![]() Markets: Forex, Crypto, Stocks, Commodities
Markets: Forex, Crypto, Stocks, Commodities
![]() Trading Style: Intraday Trading
Trading Style: Intraday Trading
![]() Helps traders refine ICT-based trading strategies
Helps traders refine ICT-based trading strategies

Best time to trade this
This works best during high-liquidity sessions:
-
London Open
-
New York Open
-
London ↔ NY overlap
Avoid:
-
Asian range (unless scalping)
-
Low-volume chop
Common mistakes (avoid these)
❌ Entering the moment liquidity is touched
❌ Ignoring higher-timeframe bias
❌ Trading every liquidity line
❌ Oversizing because “it looks obvious”
Thank You 
Be the first to review “Buy side & Sell side Liquidity MT4 Indicator”
Related products


MT4 Indicator


MT4 Indicator

Reviews
There are no reviews yet.