
-
×
 Super Long Trend Indicator | 100% Non Repaint Indicator V14.0
2 × $312.00
Super Long Trend Indicator | 100% Non Repaint Indicator V14.0
2 × $312.00 -
×
 Share Market Indicator | 100% Non Repaint Indicator V26.0
1 × $299.00
Share Market Indicator | 100% Non Repaint Indicator V26.0
1 × $299.00 -
×
 Forex Scalping Strategy | 100% Non Repaint Indicator V18.0
1 × $273.00
Forex Scalping Strategy | 100% Non Repaint Indicator V18.0
1 × $273.00 -
×
 Smart Market Structure Concepts V10 Forex Indicator MT4 |100% Non Repaint Indicator V10.0
1 × $244.00
Smart Market Structure Concepts V10 Forex Indicator MT4 |100% Non Repaint Indicator V10.0
1 × $244.00 -
×
 Pro EMA Gain | 100% Non Repaint Indicator V27.0
1 × $248.00
Pro EMA Gain | 100% Non Repaint Indicator V27.0
1 × $248.00
-76%
Higher High Lower Low MT4 Indicator
Original price was: $568.00.$134.00Current price is: $134.00.
- Original Indicator
- Trading time: Every time
- Instant Download in Zip file
- Arrows Popup Sound Alerts
- Timeframe: M5 & Above
- Use on unlimited MT4 accounts
- Type of strategy: Scalping and Long term
- Built for Metatrader 4 (MT4 for PC and Laptop, MT4 for MAC)
- Works on Forex, Stock Market, Binary Option etc.
- Customer Support & Free Upgrades For Life Time
- MQL4 Code Available $150 Only
Beyond the Crossover: How I Use Market Structure Labels to Filter Out Fakeouts
We’ve all been there—staring at a moving average that just turned green, jumping into a long position with total confidence, only to watch the market pull a violent U-turn thirty minutes later. It’s the “death by a thousand cuts” that plagues most retail traders. The truth? A moving average alone is just a lagging line on a screen. It tells you where the party was, not where it’s going.
To actually survive the gold markets (XAUUSD), you need context. Specifically, you need to know if the trend has the structural integrity to back up that color change. I’ve been experimenting with a Trend-Structure Hybrid setup that combines dynamic slope momentum with automated price-action labels (HH/LL). It’s not a “holy grail,” but it’s a damn good filter for the noise. 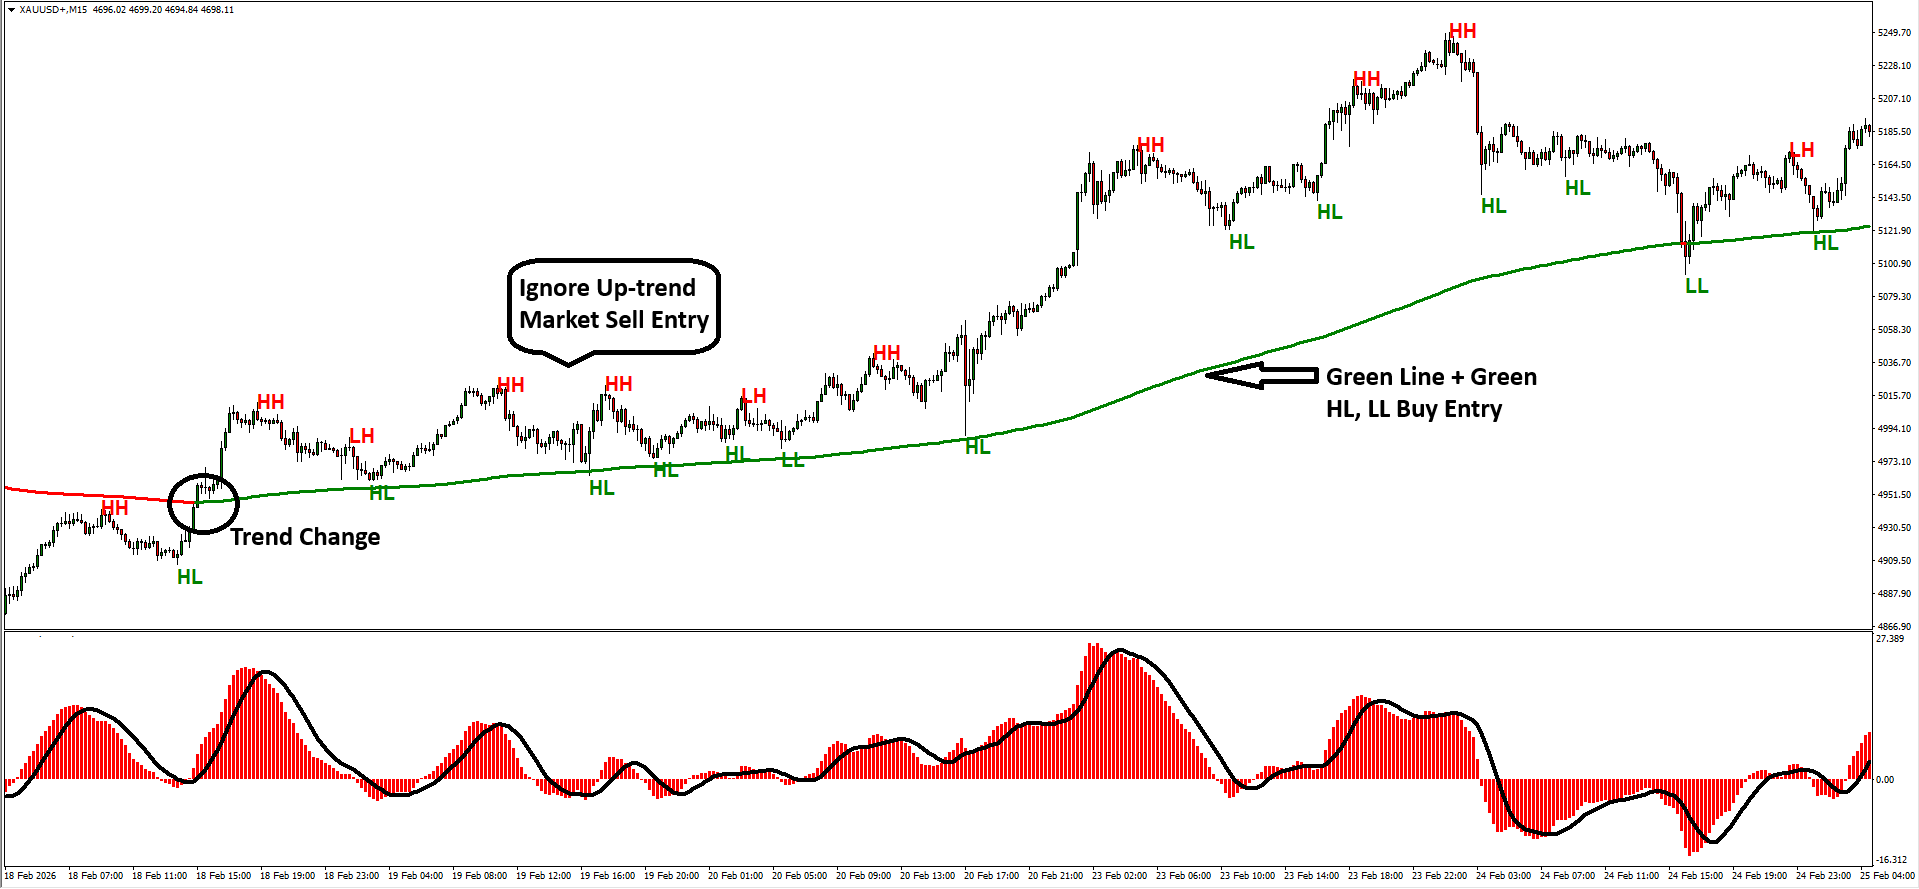
The Anatomy of the Setup: Why It Actually Works
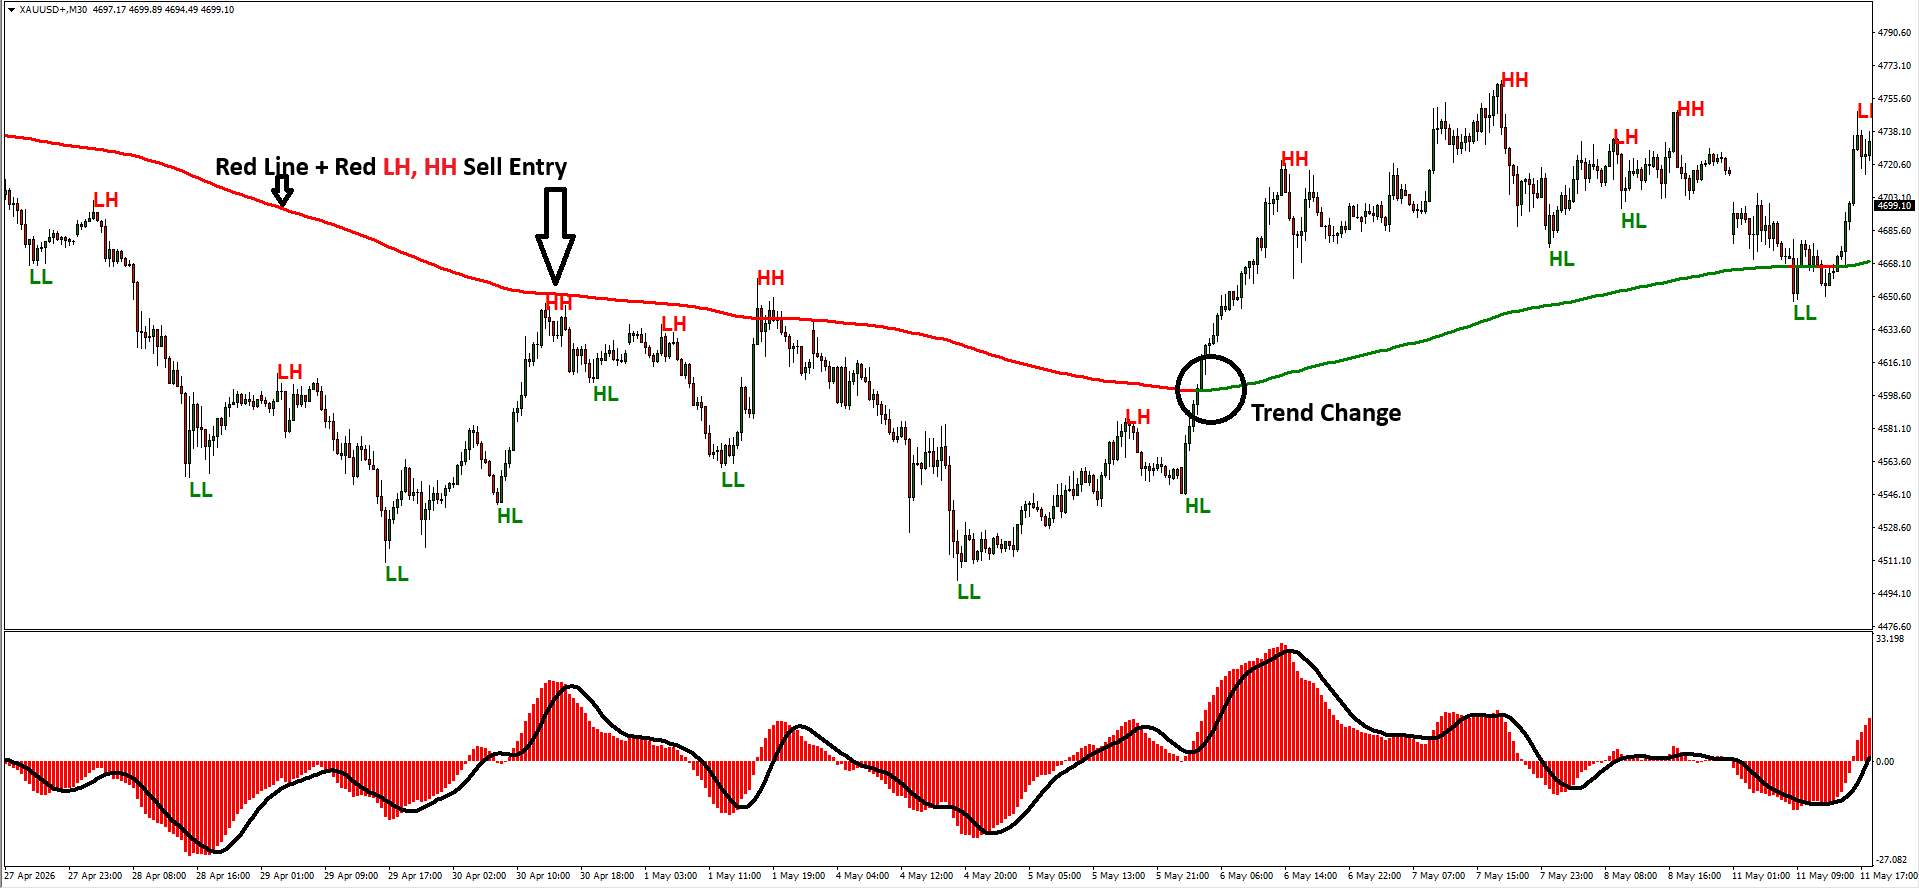
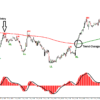
The screenshot above isn’t just a rainbow of lines; it’s a three-layered confirmation system.
- The Dynamic Slope MA: This isn’t your standard SMA. It’s a smoothed trend filter that changes color based on the rate of change. When it’s red, the bears own the playground. When it’s green, the bulls have the ball.
- The Fractal Structure Engine: This is the real MVP. It automatically identifies Higher Highs (HH), Higher Lows (HL), Lower Highs (LH), and Lower Lows (LL). It takes the subjectivity out of reading a chart. If you’re looking for a sell and the indicator prints an “LH” (Lower High) right against the red MA, the market is telling you the bounce is dead.
- The Momentum Histogram: This acts as your “gas gauge.” If price is moving up but the histogram is shrinking, you’re looking at a low-fuel rally.
The Strategy: Hunting for the “Structure Touch”
I don’t trade every time the line changes color. That’s a recipe for getting chopped up in a range. Instead, I look for the Mean Reversion Entry. 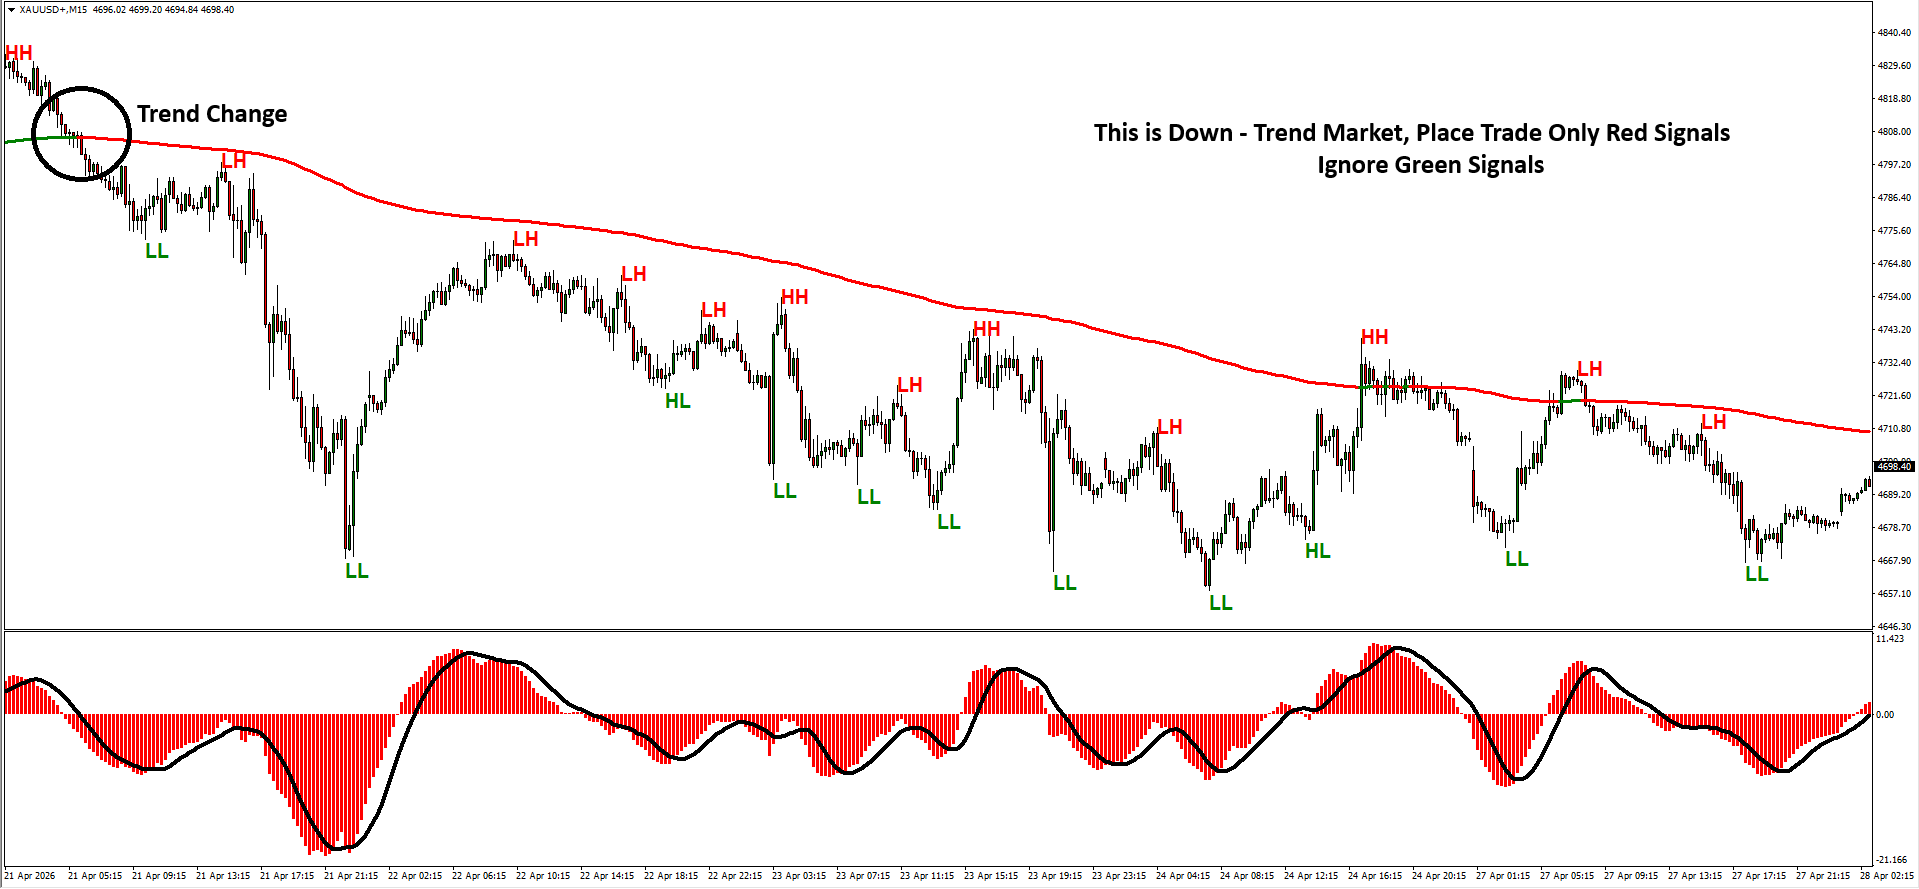
The Sell Logic (Bearish Phase)
- The Filter: The MA line must be Red.
- The Trigger: Price must pull back up to touch or hover near the Red line.
- The Confirmation: Wait for the indicator to print a Red LH (Lower High) or HH (Higher High) label at that resistance zone.
- The Momentum: The histogram below should ideally be red or crossing back below the zero line.
The Buy Logic (Bullish Phase)
- The Filter: The MA line must be Green.
- The Trigger: A price dip back toward the Green line.
- The Confirmation: Look for a Green HL (Higher Low) or LL (Lower Low) label to print near the line.
- The Momentum: Histogram should be green and expanding upward.
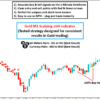
Best Assets & Timeframes: I’ve found this most reliable on XAUUSD (Gold) and GBPUSD on the M30 or H1 timeframes. Anything lower than M15 tends to produce too many “micro-structures” that lack real weight. 
Pro-Practitioner Secrets (The Stuff YouTube Won’t Tell You)
- Ignore the “Circle of Death”: See that “Trend Change” circle in the screenshot? Most amateurs buy the exact moment the line turns green. Don’t do that. Wait for the first pullback to the green line that forms an HL (Higher Low). That first pullback is the market’s way of proving the new trend is real.
- Watch the Slope Angle: If the MA line is flat (horizontal), ignore the colors. This indicator is a trend-follower. In a sideways market, it will lie to you. Only take entries when the line is clearly angled at 45 degrees.
- The Divergence Exit: If you’re in a sell trade and price makes a new LL (Lower Low), but the histogram makes a higher bottom, get out. That’s bullish divergence, and it usually precedes a sharp reversal.
LinkedIn Snippet: Stop Guessing Trend Reversals 📉
Most traders fail because they treat moving averages like magic wands. They aren’t.
I’ve been using a Market Structure + Momentum framework to stop catching falling knives. The secret isn’t just the “Trend Change”—it’s the confirmation of Lower Highs (LH) and Higher Lows (HL) against a dynamic baseline.
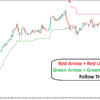
My Rule of Thumb: ✅ Red Line + LH Label = High-Probability Sell. ✅ Green Line + HL Label = High-Probability Buy. ❌ Flat Line = Stay in cash.
Trading is about confluence, not clicking buttons on every crossover. Are you trading price action, or just following a line 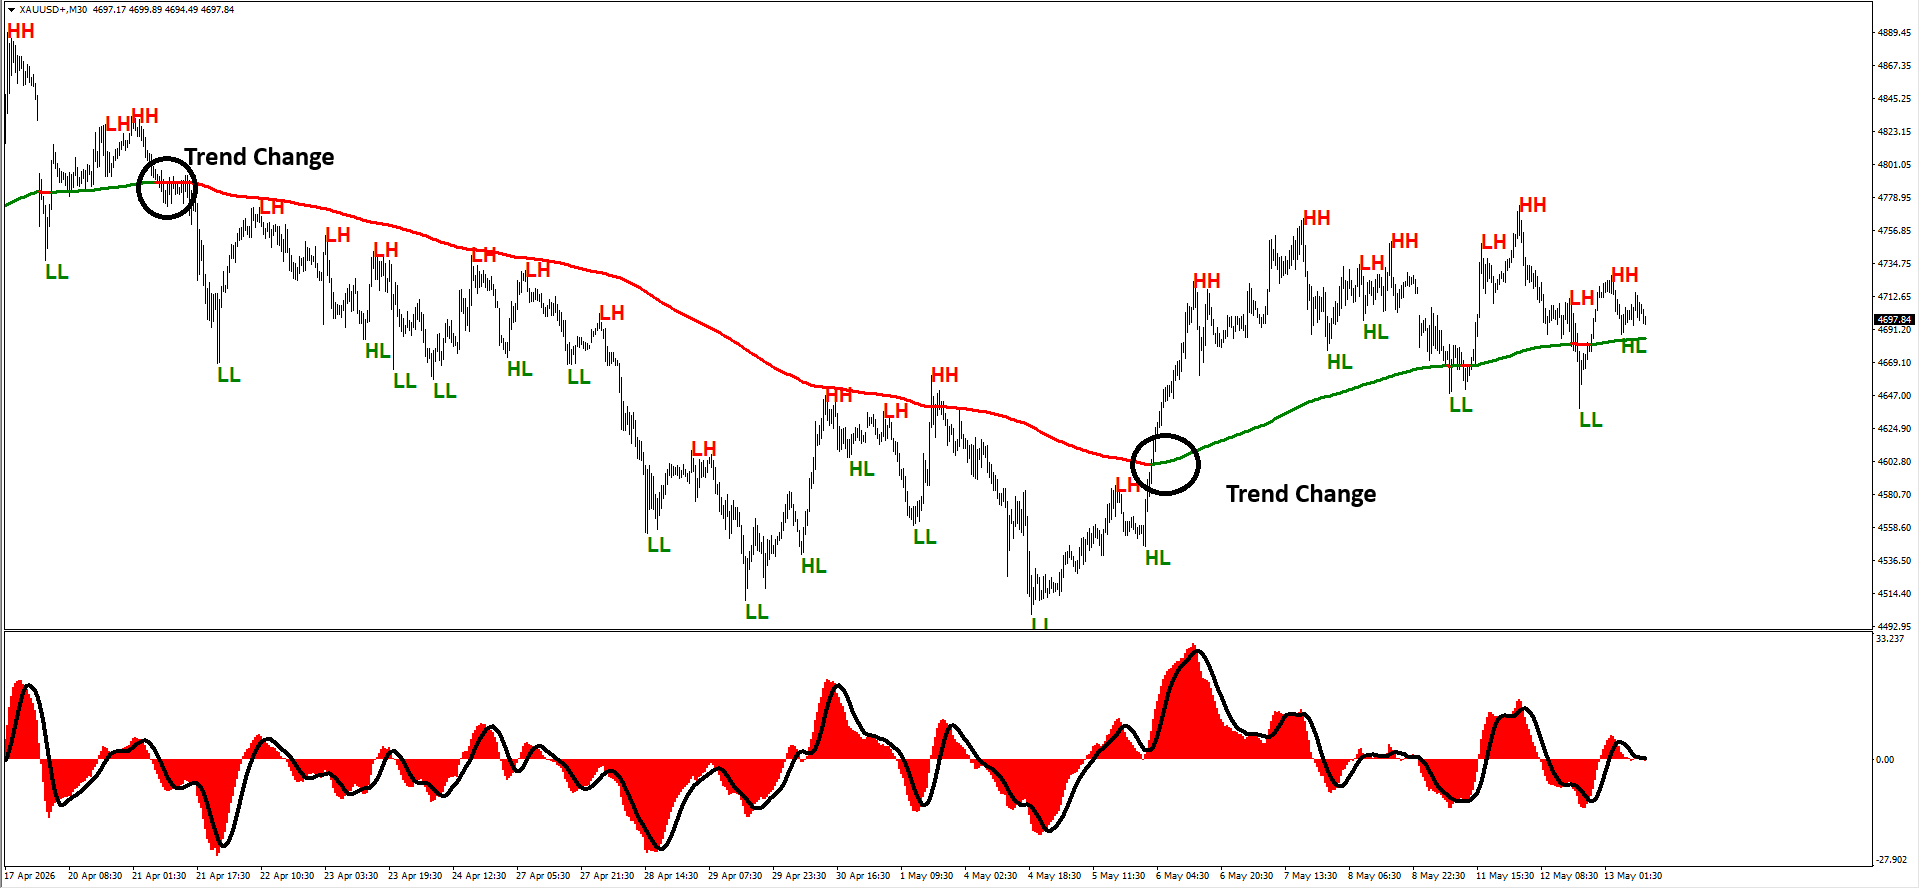
Be the first to review “Higher High Lower Low MT4 Indicator”
Related products
-70%


Original price was: $999.00.$299.00Current price is: $299.00.
-67%

Original price was: $729.00.$244.00Current price is: $244.00.
-71%


Original price was: $999.00.$289.00Current price is: $289.00.
-70%


Original price was: $999.00.$299.00Current price is: $299.00.
-75%


Original price was: $999.00.$249.00Current price is: $249.00.
-71%


Original price was: $855.00.$249.00Current price is: $249.00.
-64%

Original price was: $829.00.$299.00Current price is: $299.00.
-72%


Original price was: $966.00.$274.00Current price is: $274.00.
Reviews
There are no reviews yet.