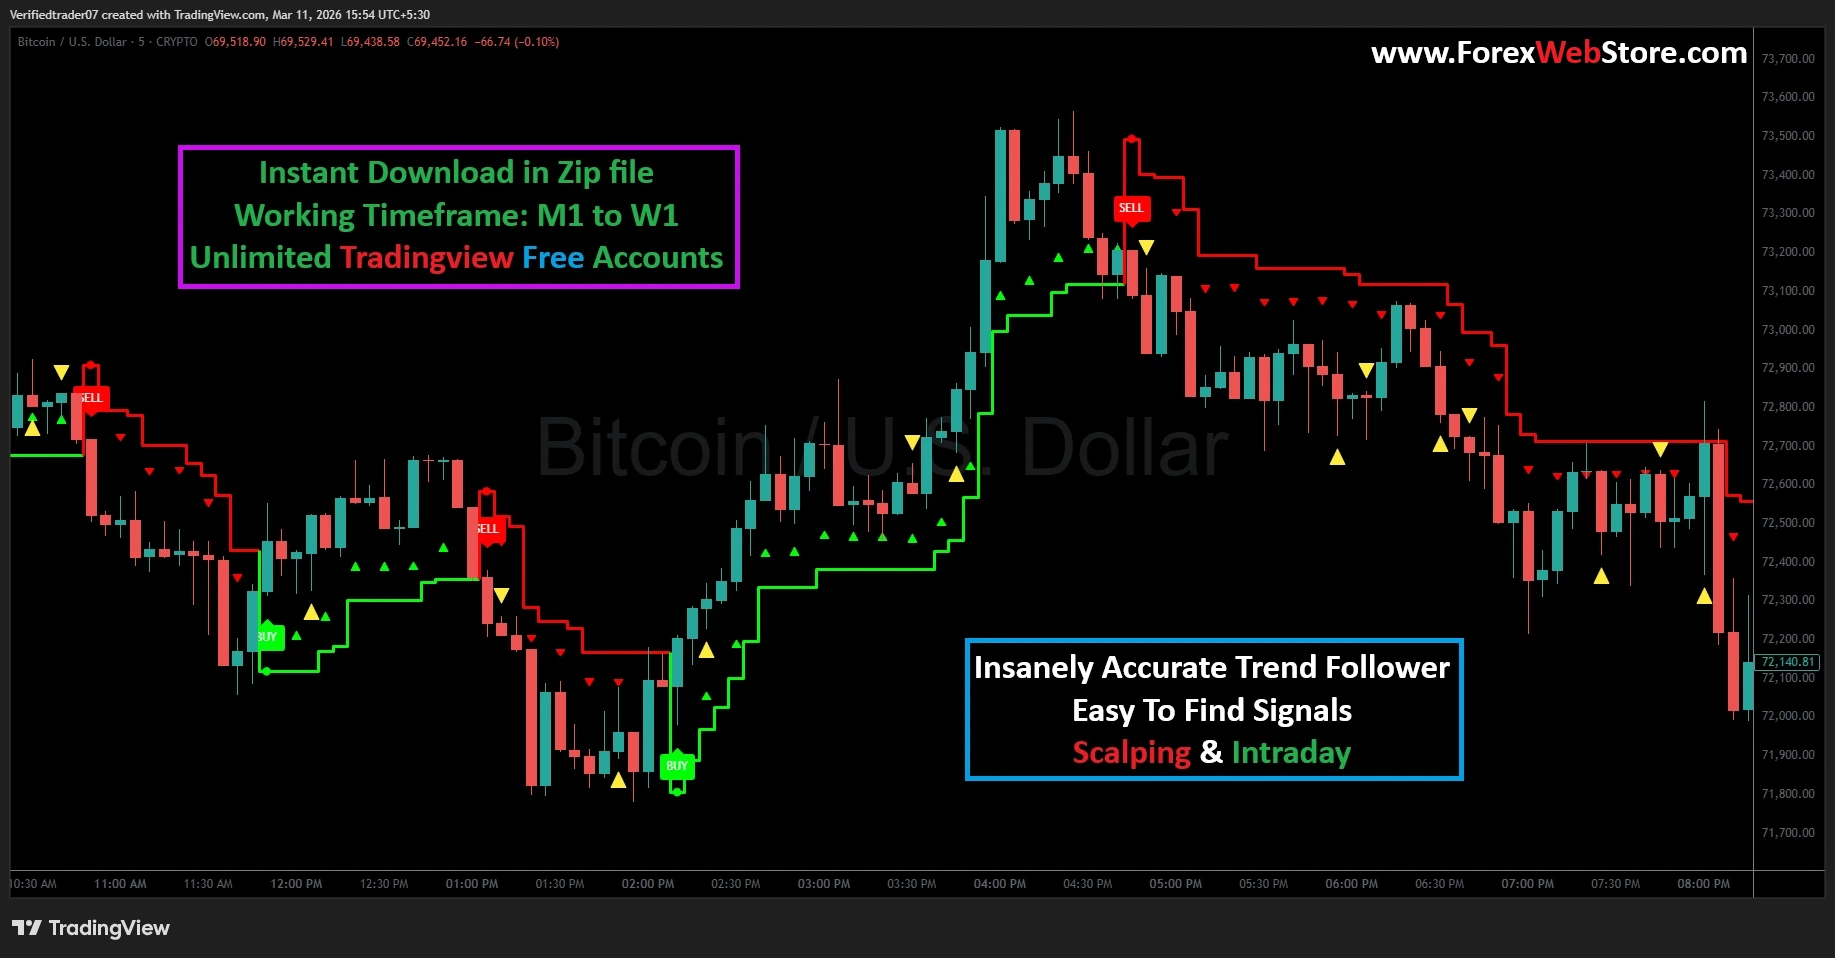

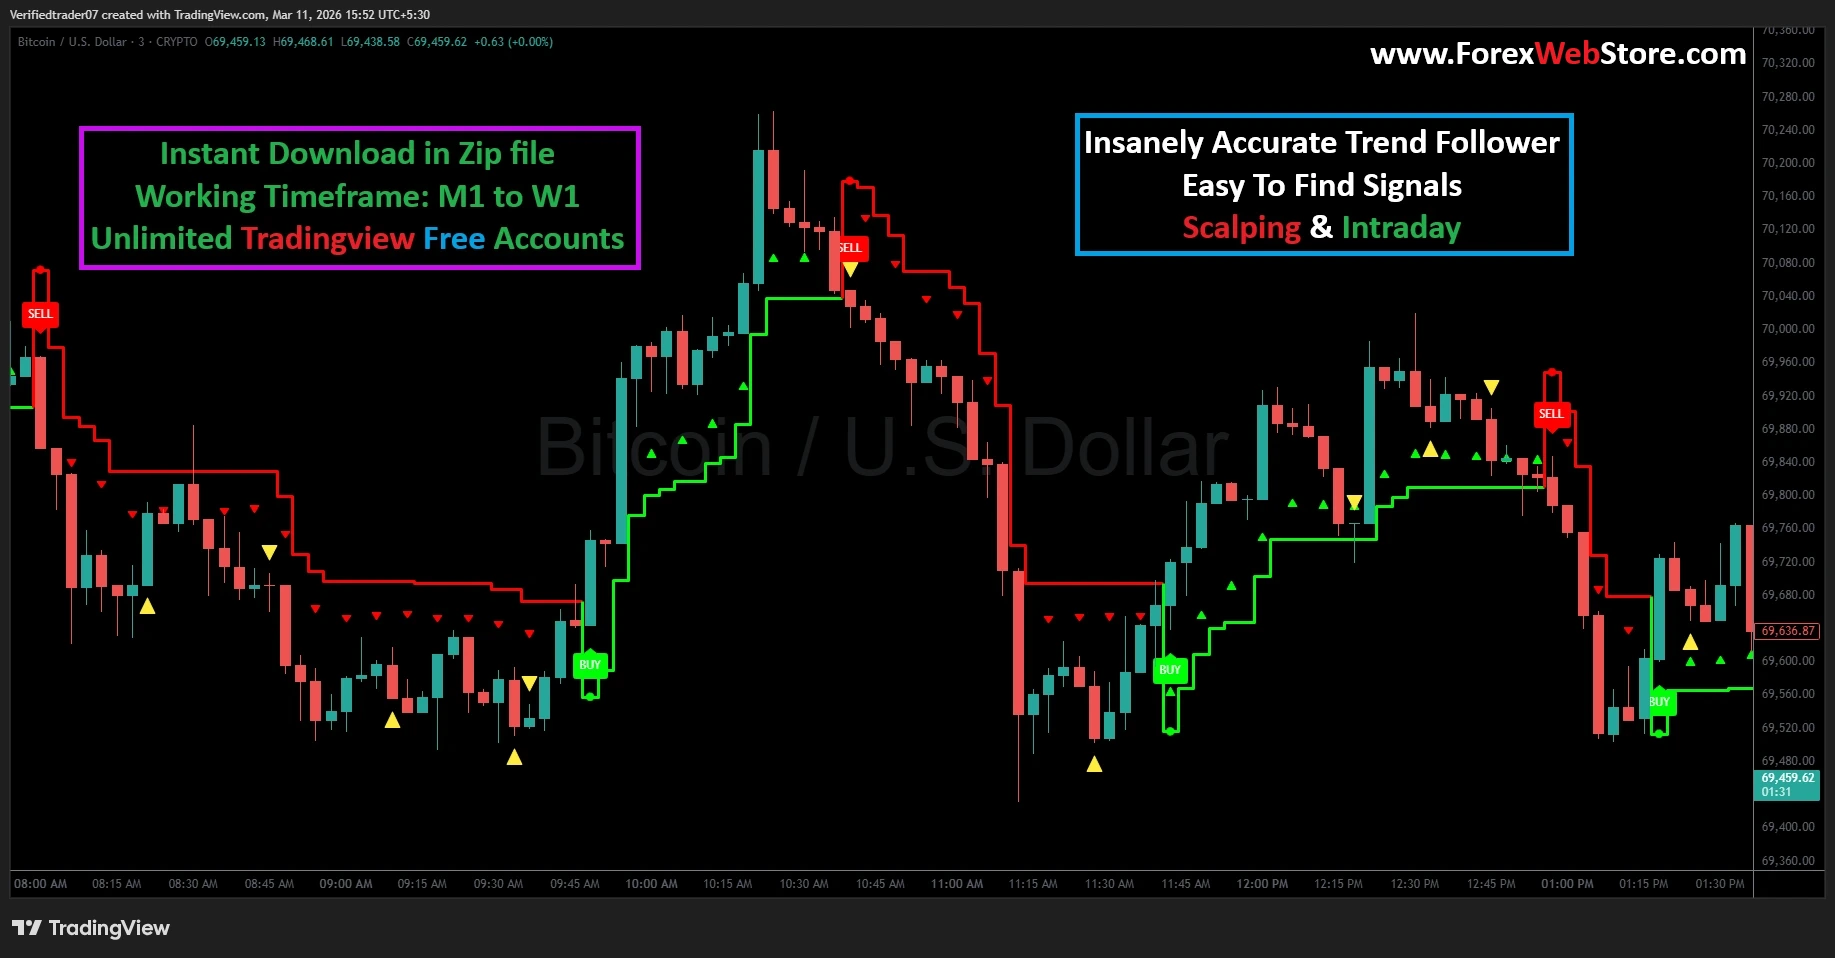

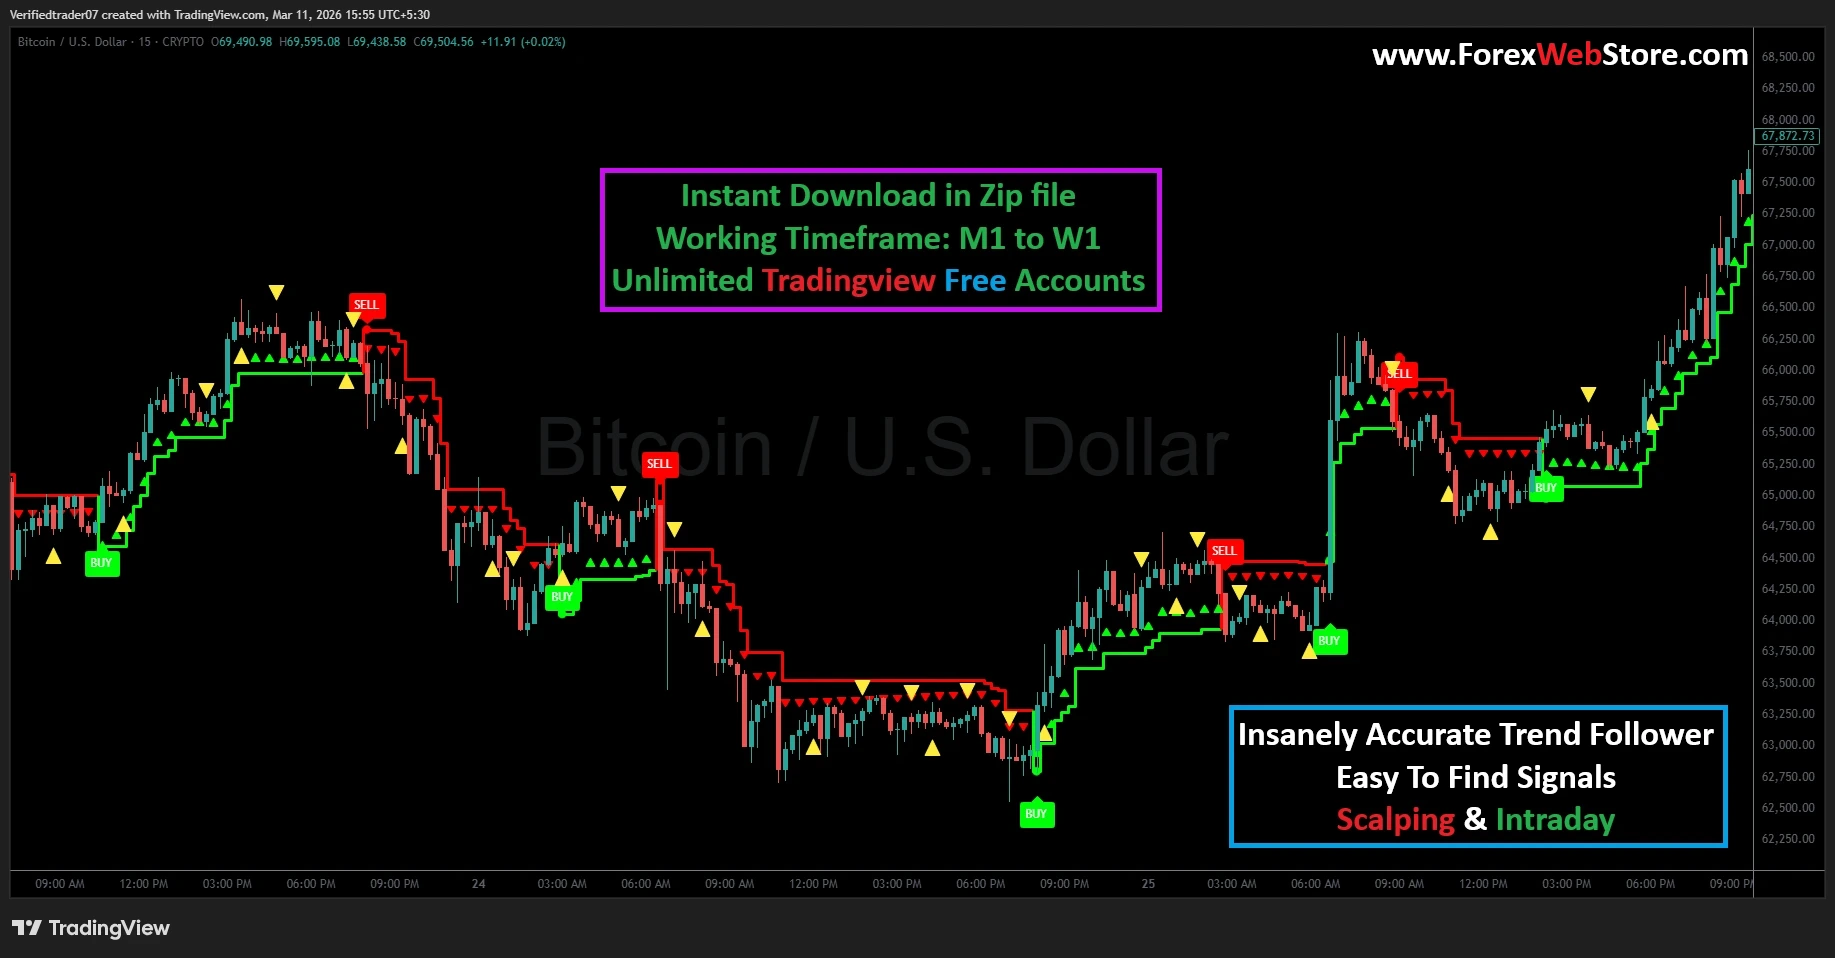
Insanely Accurate Trend Follower

Original price was: $1,500.00.$232.00Current price is: $232.00.
- Original Indicator
- Trading time: Every time
- Instant Download in Zip file
- Working Timeframe: M1 to W1
- Use on Unlimited Tradingview Accounts
- Type of strategy: Scalping and Intraday
- Source Code:- Pine script
- Works on All pairs Forex, Crypto, Stock Marke etc.
- Customer Support & Free Upgrades
- Lifetime Version
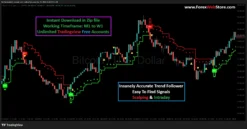
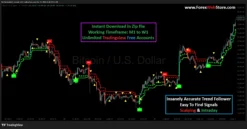
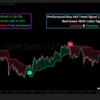
The ForexPine Trend Follower is a sophisticated technical analysis tool designed for TradingView. It operates as a trend-following volatility system, primarily used to identify market momentum shifts and high-probability entry points. While it is versatile enough for any timeframe (M1 to W1), its visual logic is specifically optimized for scalping and intraday trading on high-liquidity assets like Bitcoin (BTC/USD) and major Forex pairs.

1. Primary Function & Overview
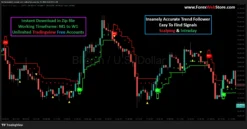
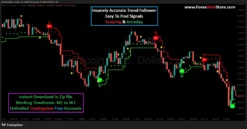
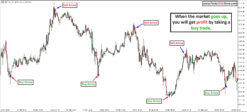
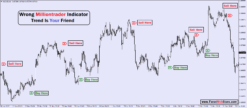
The indicator’s core purpose is to filter market “noise” and provide traders with a clear visual representation of the current trend. It utilizes a stepped-line mechanism—shifting between Green (Bullish) and Red (Bearish)—to act as a dynamic trailing stop and trend identifier. By combining price action with volatility-based calculations, it helps traders stay on the right side of the market while avoiding premature exits during minor pullbacks.
2. How to Use: Entry and Exit Signals
To get the most out of this system, you should focus on the confluence of the colored lines and the specific signal labels.
Buying (Long Positions)
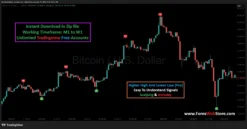
- The Primary Entry: Look for the price to cross above the red resistance line, triggering a green “BUY” label and a shift to a green stepped support line.
- Confirmation: Ensure the candle closes above the green line before entering.
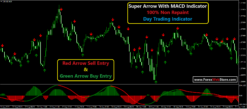
- Add-on Signals: The small green triangles appearing above the green line represent “Trend Continuation” opportunities. These are ideal for adding to an existing position or entering if you missed the initial breakout.
- Exit/Stop Loss: Place your Stop Loss slightly below the green stepped line. Exit the trade when a “SELL” signal appears or when price closes below the green support.
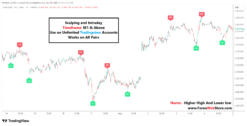
Selling (Short Positions)
- The Primary Entry: Wait for the price to drop below the green support line, triggering a red “SELL” label and a shift to a red stepped resistance line.
- Confirmation: The entry is valid once the candle closes firmly below the line.
- Add-on Signals: Small yellow or red triangles appearing below the red line indicate bearish momentum is sustaining, offering secondary entry points.
- Exit/Stop Loss: Position your Stop Loss just above the red stepped line. Close the position when a “BUY” signal is generated or when price action breaks back above the red resistance.

3. Step-by-Step Setup Instructions
- Open TradingView: Load your desired chart (e.g., BTC/USD).
- Select Timeframe: For scalping, use the 1-minute (M1) to 5-minute (M5) charts. For intraday trading, the 15-minute (M15) or 1-hour (H1) charts are recommended.
- Install the Indicator: Since this is a custom script from ForexPine, you will typically need to navigate to the “Editors” tab or “Indicators” menu and search for the specific name or paste the provided Pine Script code into the Pine Editor and click “Add to Chart.”
- Configure Settings: Most users find the default settings optimal. However, you can adjust the “Sensitivity” or “ATR Factor” in the settings menu to make the signals tighter (for faster scalping) or wider (for swing trading).
4. The Logic Behind the Signals
The indicator is built on a modified Average True Range (ATR) and Price Action Trend logic.
- Volatility-Based Trailing: The stepped lines (red and green) represent a volatility-adjusted distance from the price. When the market moves significantly in one direction, the “gap” between price and the line narrows.
- Trend Flip: When the price “breaks” the volatility threshold (closes on the opposite side of the line), the algorithm recognizes a trend reversal. This triggers the Buy/Sell labels.
- Momentum Confirmation: The smaller triangles analyze short-term momentum. They look for “pullbacks” to the mean that quickly resume in the direction of the primary trend, ensuring you don’t chase the price at the top or bottom of a move.

5. Pro-Tips for Maximum Accuracy
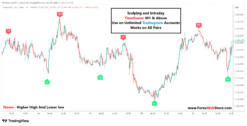
- The “Higher Timeframe” Filter: Never trade against the trend of a higher timeframe. If the H1 chart shows a strong Green/Buy trend, only take “BUY” signals on the M5 chart. This significantly increases your win rate by aligning you with the “Big Money” flow.
- Avoid the “Sideways” Trap: All trend followers struggle in choppy, sideways markets. If you notice the stepped lines flipping between red and green frequently in a narrow price range, stay out of the market. Wait for a clear “breakout” with a strong candle body.
- Wait for the Close: This is the most common mistake. Always wait for the current candle to close before entering a trade based on a label. Signals can “flicker” during high volatility; the candle close confirms that the momentum has actually shifted.

Related products
Tradingview
Tradingview

MT4 Indicator
MT5 Indicator

Tradingview

MT4 Indicator
MT4 Indicator
MT4 Indicator