
-
×
 Bitcoin M1 To M5 Buy sell Tradingview
1 × $259.00
Bitcoin M1 To M5 Buy sell Tradingview
1 × $259.00 -
×
 Stepped Trend Pro with SLTP
1 × $199.00
Stepped Trend Pro with SLTP
1 × $199.00 -
×
 Buy Sell Gold M1 Tradingview
1 × $280.00
Buy Sell Gold M1 Tradingview
1 × $280.00 -
×
 No More Losses Buy Sell Signal Indicator
1 × $180.00
No More Losses Buy Sell Signal Indicator
1 × $180.00
-91%
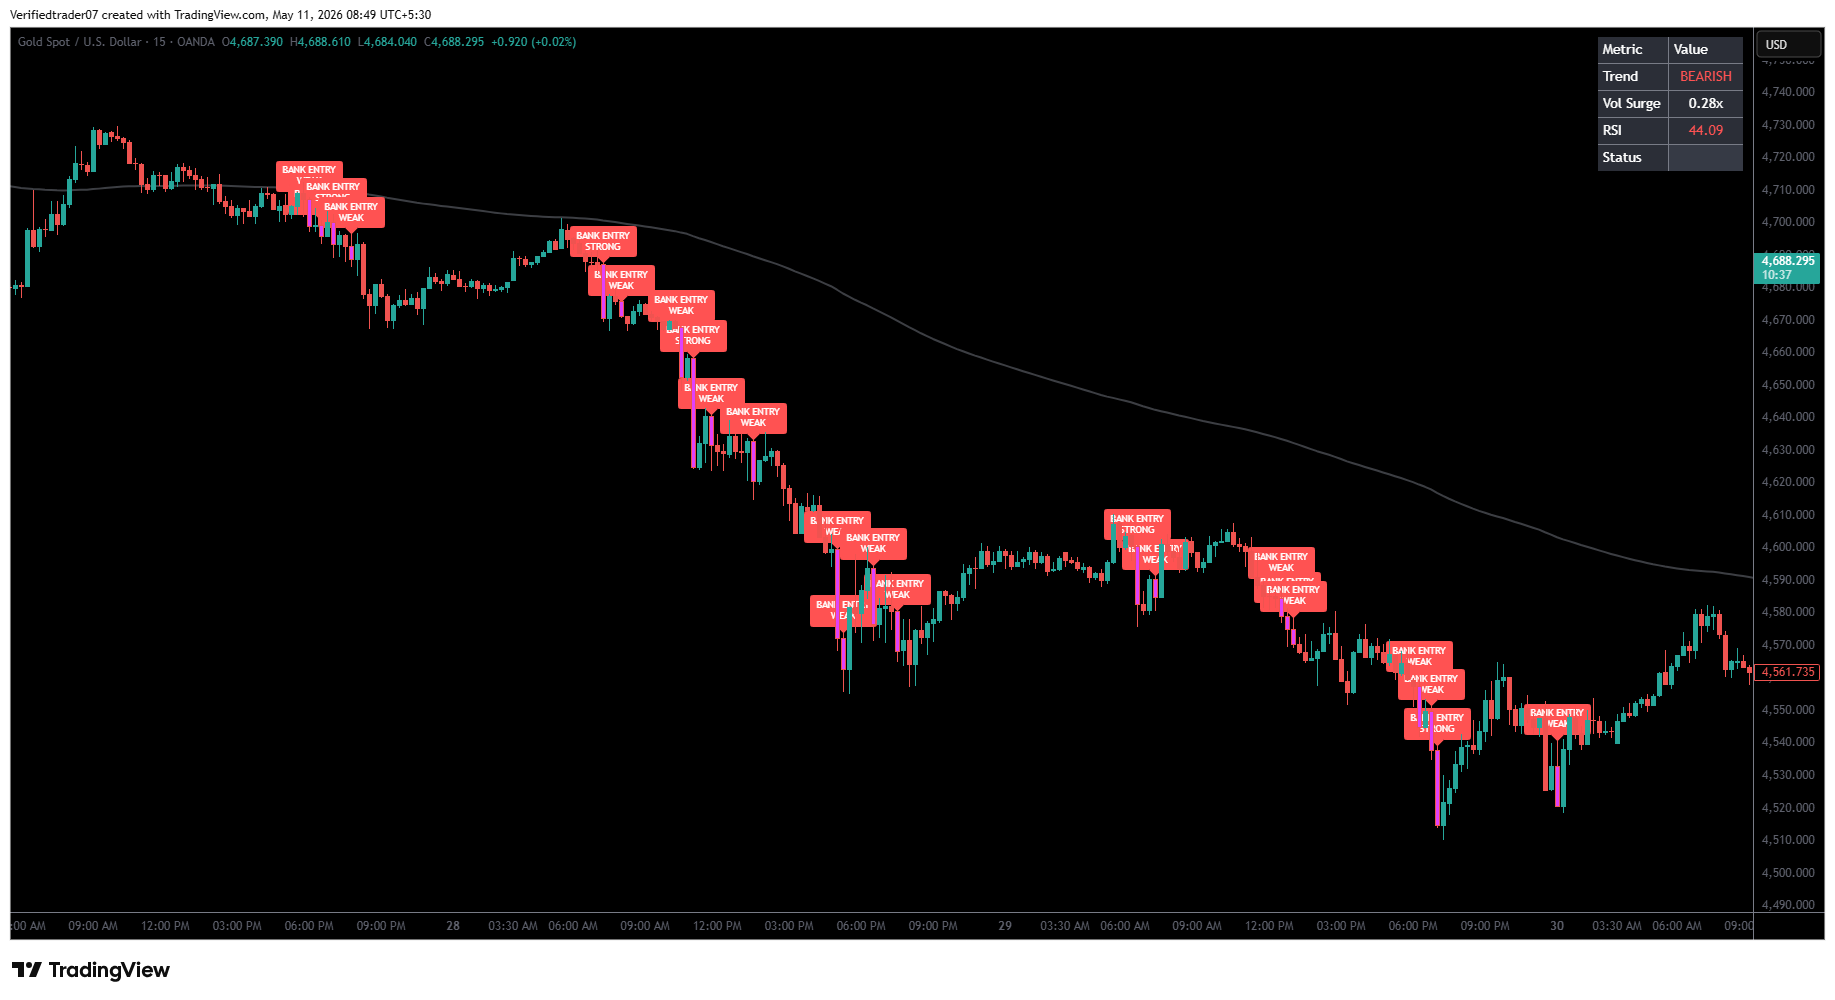
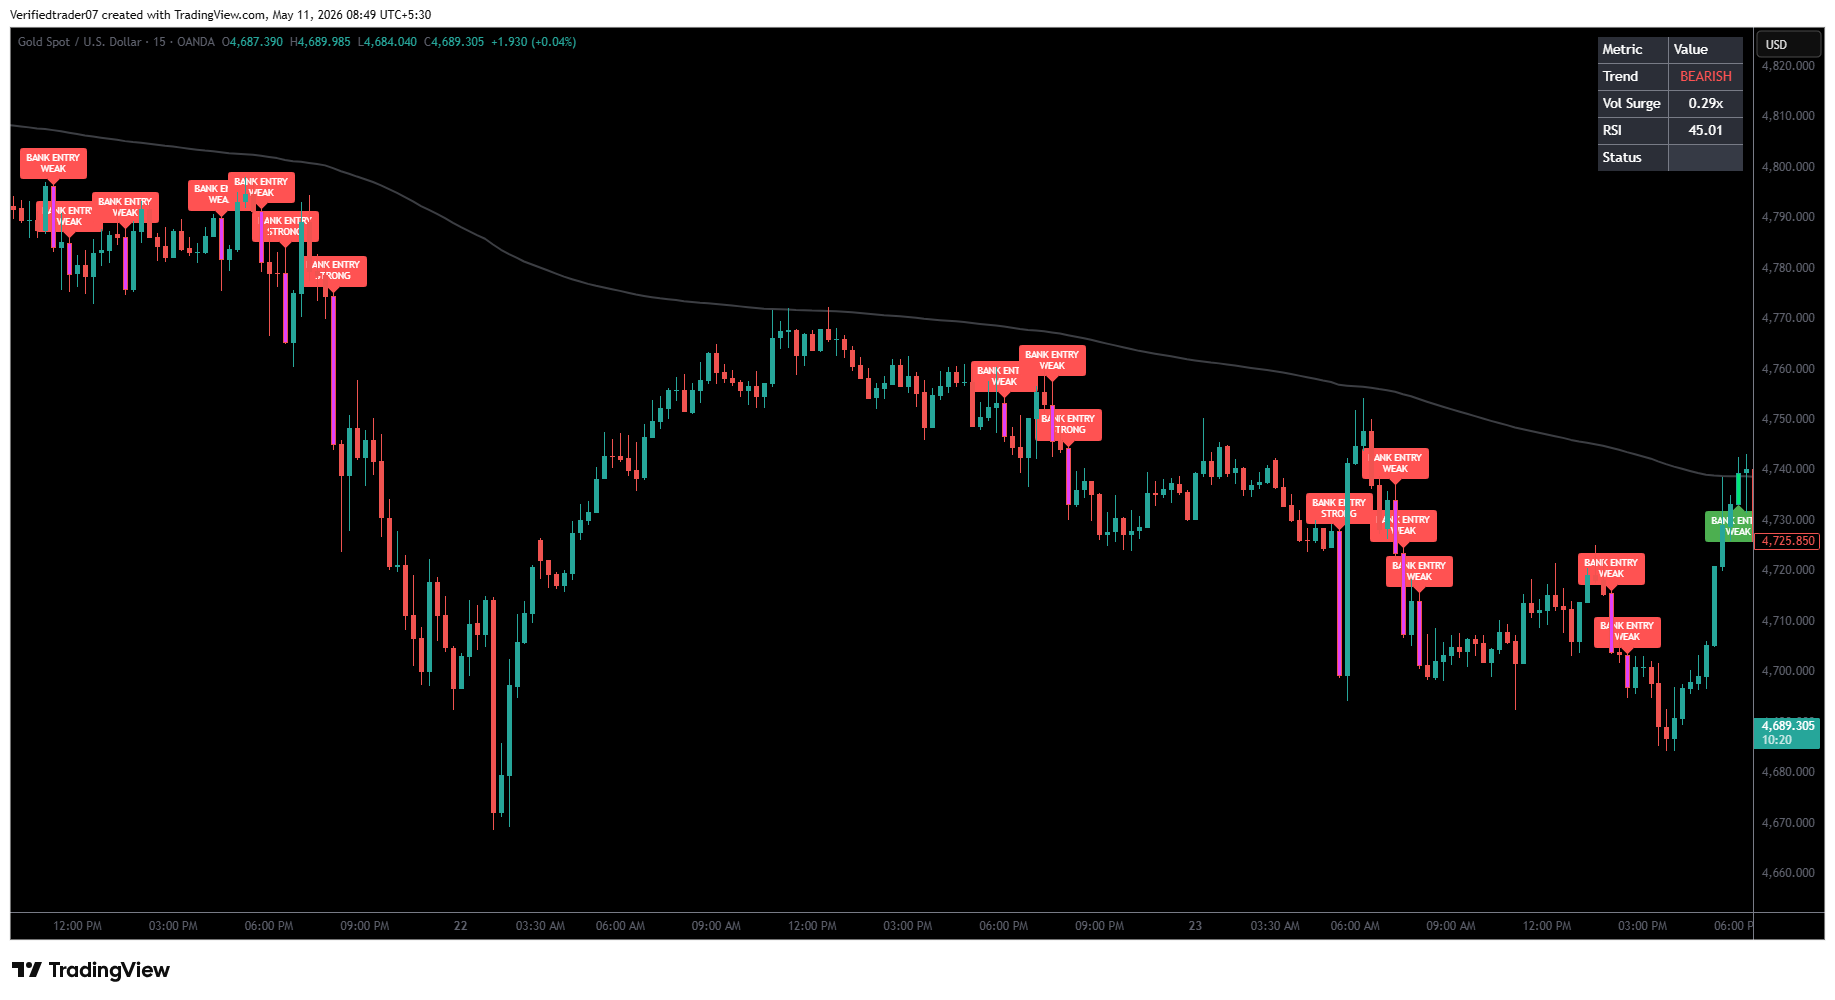
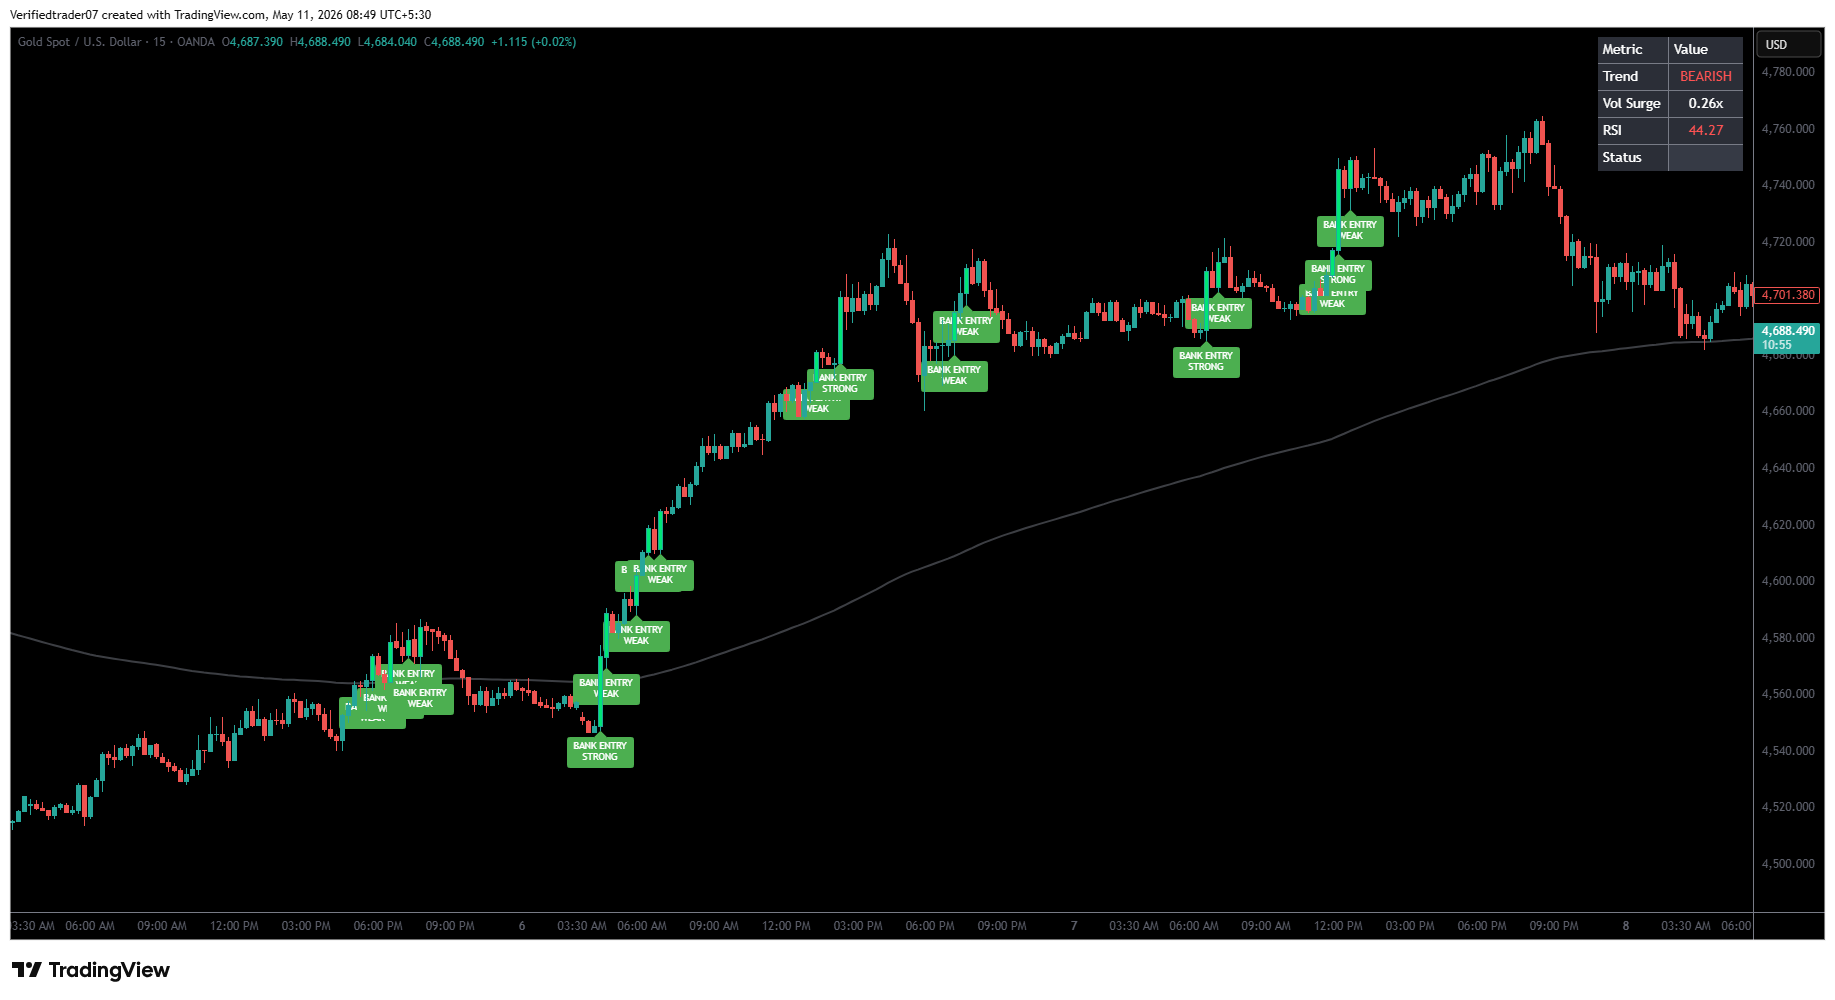
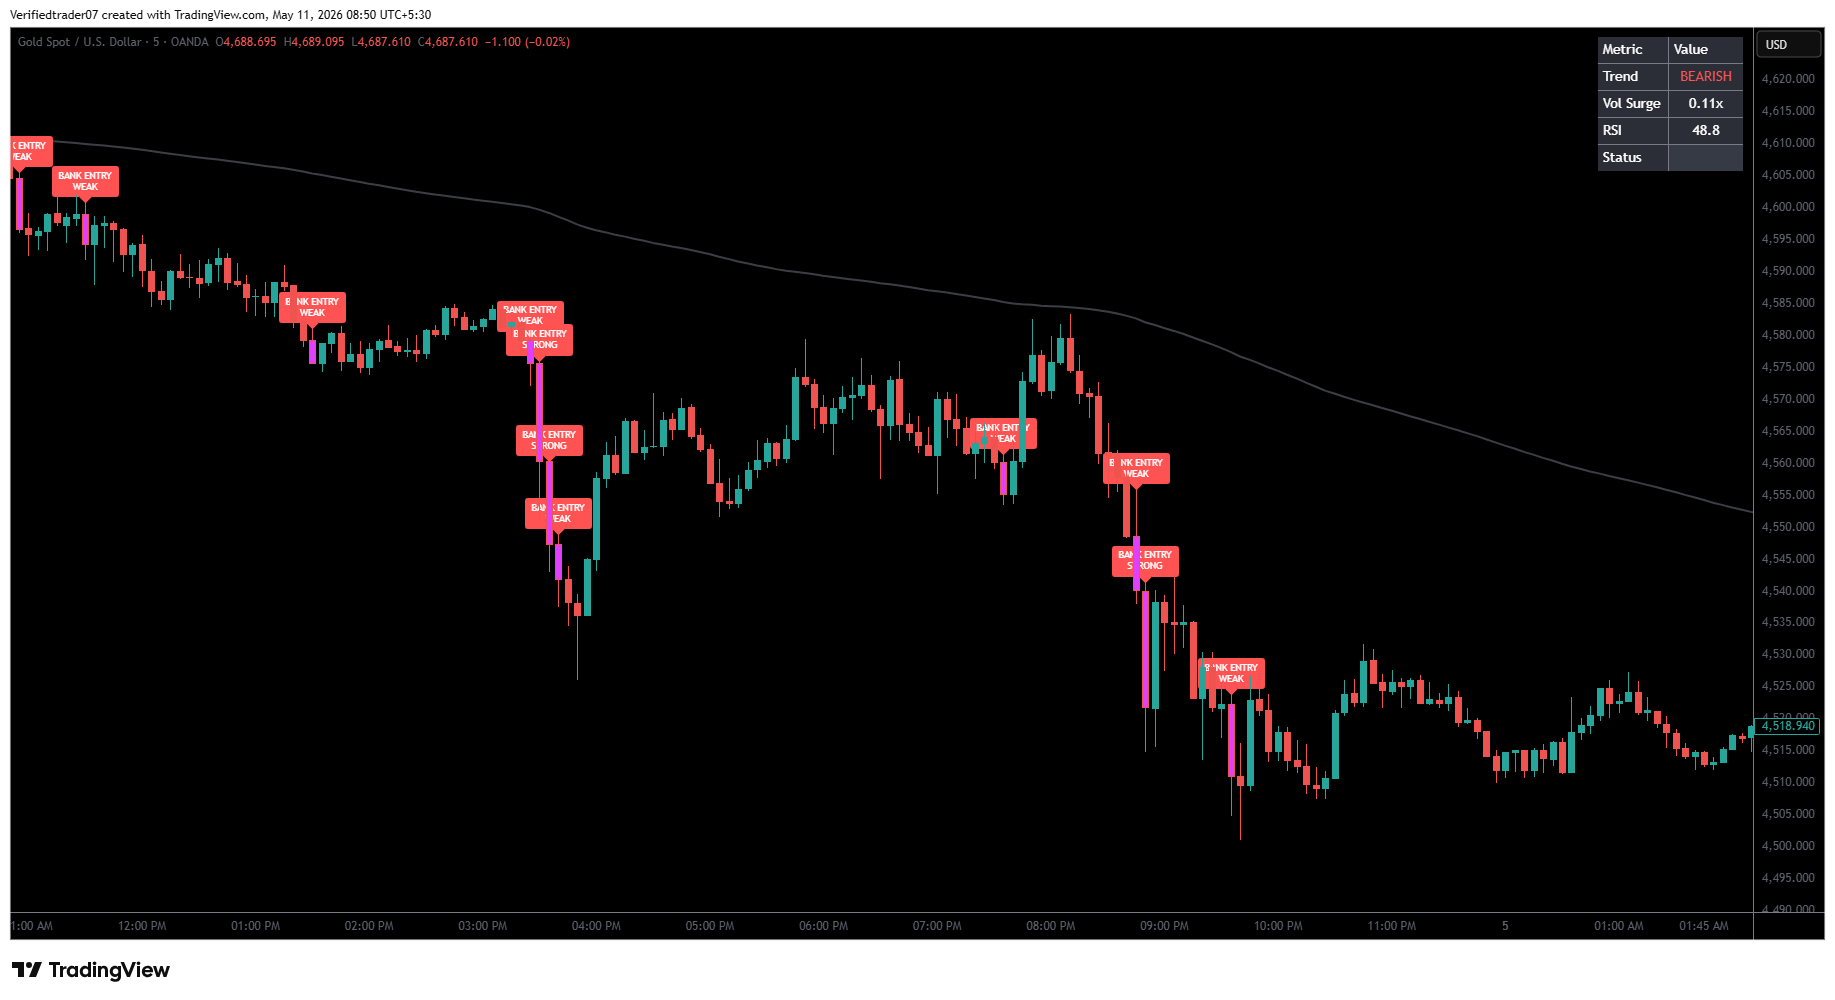
Institutional Smart Money TradingView Indicator

Original price was: $1,426.00.$129.00Current price is: $129.00.
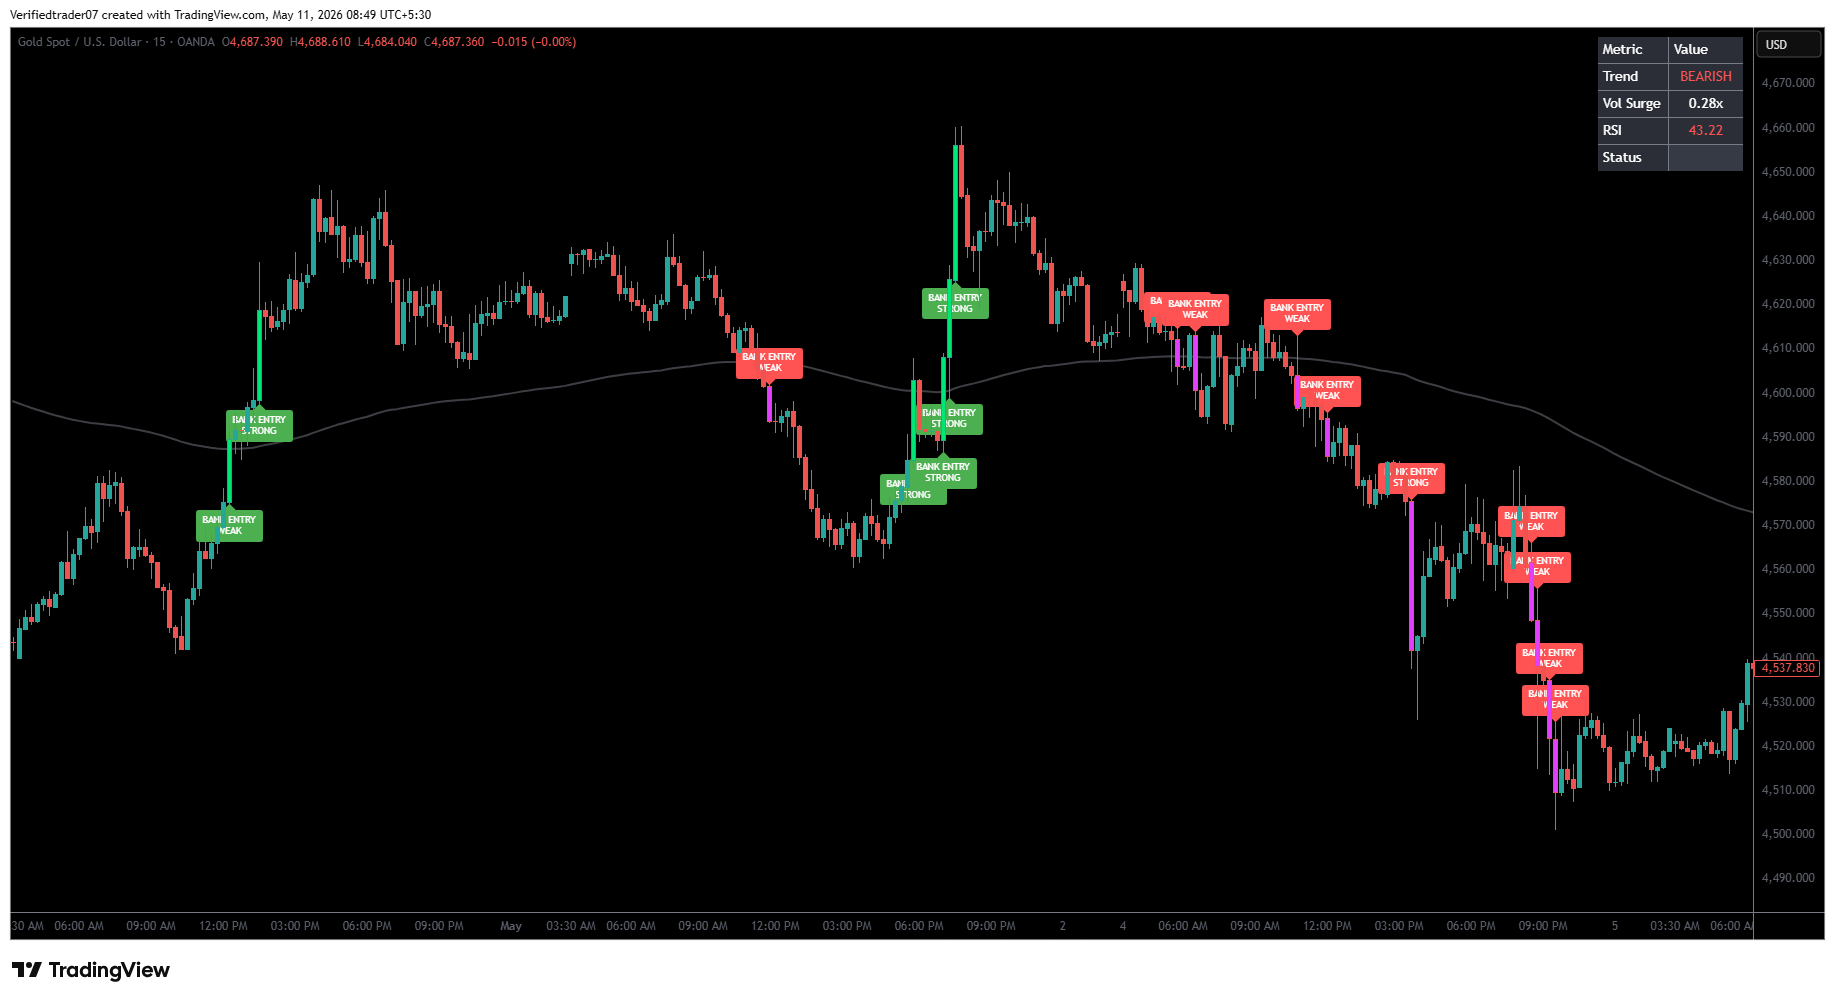
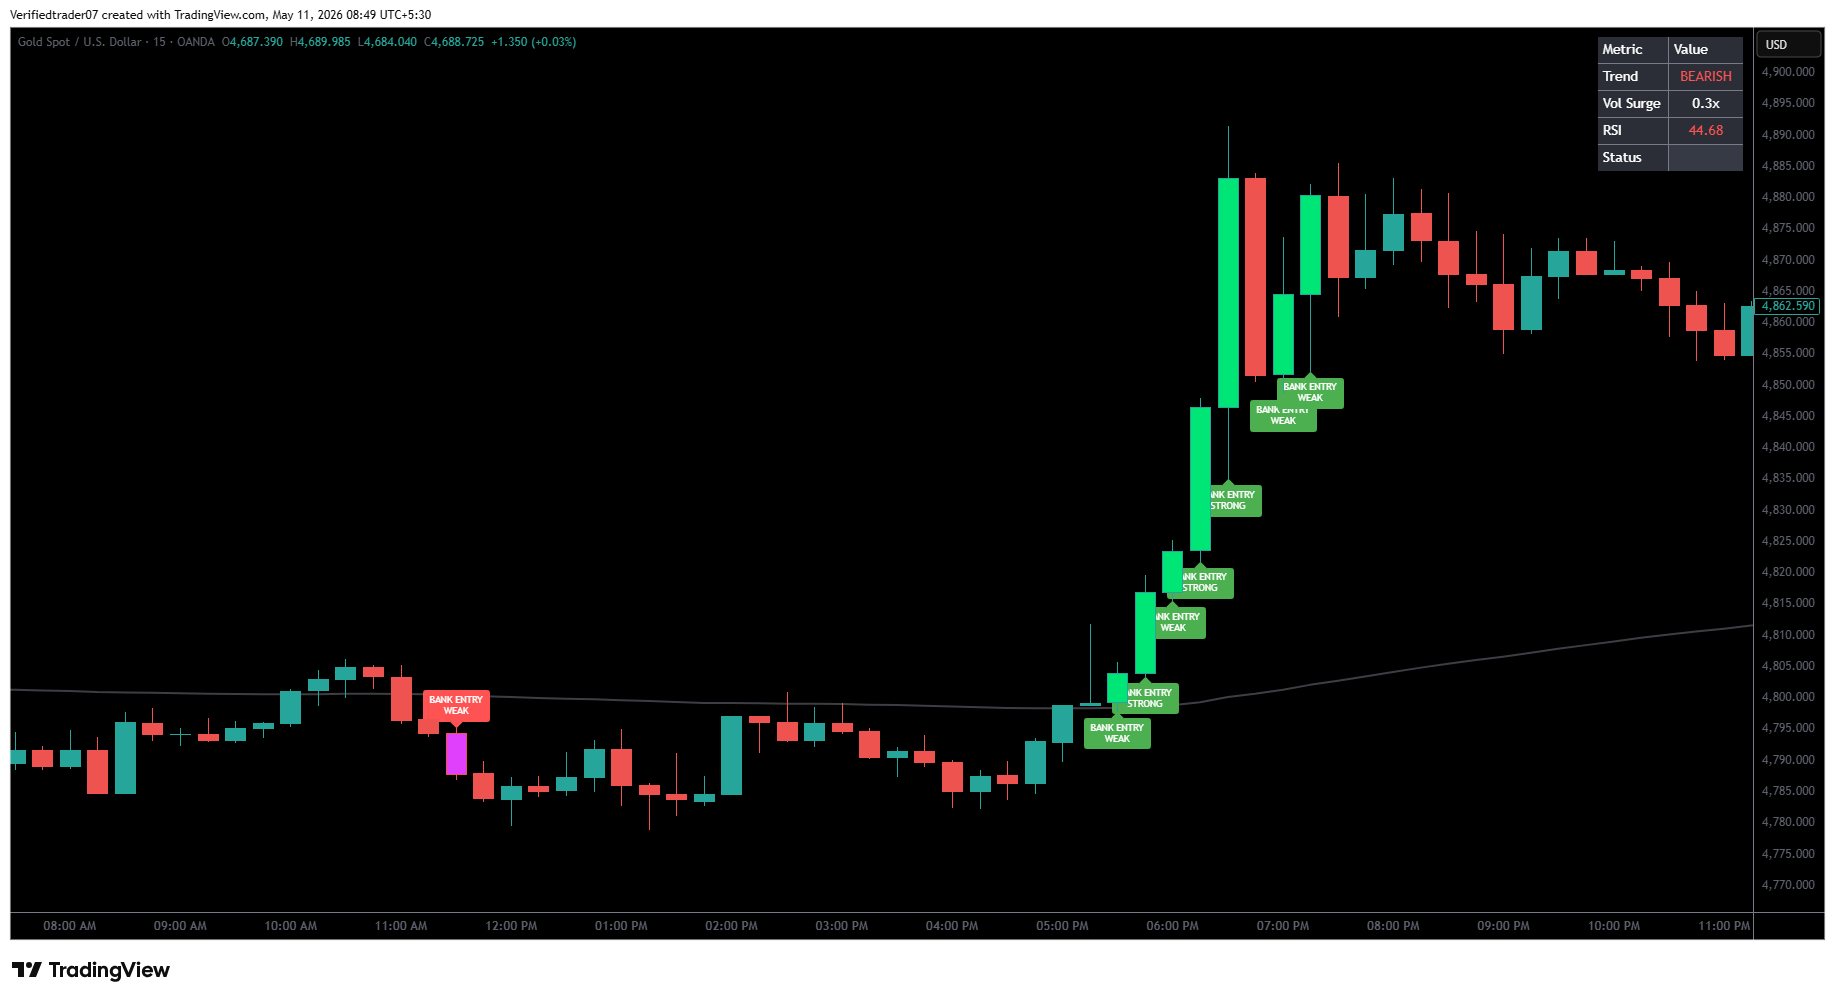
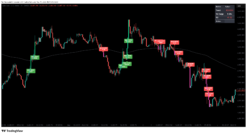
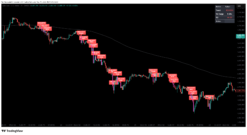
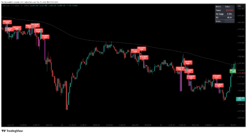
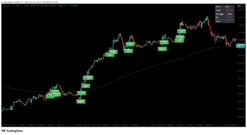
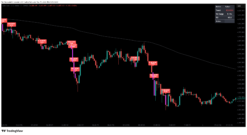
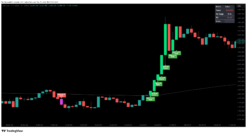
Trade alongside institutional order flow with the Bank Entry TradingView Indicator. Engineered for high-volatility markets like Gold (XAUUSD) and Forex, this tool uses real-time volume expansion, momentum filters, and dynamic trend lines to highlight high-probability institutional setups.
-
Smart Money Signals: Clear
BANK ENTRY STRONGlabels for high-confluence trades. -
On-Screen Dashboard: Live tracking for Trend Direction, Volume Surge, and RSI.
-
Dynamic Trend Baseline: Instantly filter out bad trades by staying on the right side of the macro trend.
-
Multi-Timeframe Scalping: Optimized for M1, M5, and M15 fast-execution trading.
Institutional Smart Money TradingView Indicator
This indicator is built specifically for TradingView to help retail traders spot institutional market moves in real-time. Instead of relying on traditional lagging indicators, it tracks institutional volume, momentum shifts, and key trend baselines to pinpoint exact entry points for high-volatility assets like Gold (XAUUSD), Forex pairs, and Cryptocurrencies.
On-Screen Dashboard & Core Elements
1. The Dynamic Baseline (Moving Average Line)
The center trendline acts as your macro market filter:
-
Price Above Line: Market is in a macro Bullish state. Focus primarily on Buy entries.
-
Price Below Line: Market is in a macro Bearish state. Focus primarily on Sell entries.
2. Signal Labels
-
🟩 BANK ENTRY STRONG (Green): High-probability bullish signal supported by heavy buyer momentum and volume.
-
🟩 BANK ENTRY WEAK (Green): Lower-probability bullish bounce (often counter-trend or early entry).
-
🟥 BANK ENTRY STRONG (Red): High-probability bearish signal supported by heavy institutional sell volume.
-
🟥 BANK ENTRY WEAK (Red): Lower-probability bearish retracement signal.
3. Live Data Dashboard (Top Right)
-
Trend: Displays real-time higher-timeframe directional bias (BEARISH / BULLISH).
-
Vol Surge: Measures volume expansion (e.g.,
0.28x) to tell you if institutions are actively participating. -
RSI: Real-time momentum reading to detect overbought/oversold conditions instantly.
How to Trade the M1 Timeframe (Step-by-Step)
When trading ultra-fast 1-minute (M1) charts with this indicator, execution speed and trend alignment are everything.
M1 Buy Setup
-
Trend Check: Verify that the dynamic baseline is sloping upward and the dashboard shows a supportive trend.
-
Signal: Wait for a 🟩 BANK ENTRY STRONG label to print under a closed candle.
-
Execution: Open a BUY position at the open of the very next candle.
M1 Sell Setup
-
Trend Check: Verify that the dynamic baseline is sloping downward and the dashboard reads BEARISH.
-
Signal: Wait for a 🟥 BANK ENTRY STRONG label to print above a closed candle.
-
Execution: Open a SELL position at the open of the very next candle.
Risk Management: Stop Loss & Take Profit Guidelines
Stop Loss (SL) Rules
-
Buy Trades: Place your Stop Loss 3 to 5 pips below the recent swing low (or just beneath the signal candle’s low).
-
Sell Trades: Place your Stop Loss 3 to 5 pips above the recent swing high (or just above the signal candle’s high).
Take Profit (TP) Rules
-
Fixed Risk-to-Reward: Target a minimum 1:1.5 to 1:2 Risk-to-Reward Ratio.
-
Baseline Target: On quick M1 scalps, exit the trade or lock in partial profits once the price hits or crosses the central baseline.
-
Opposite Signal Exit: Close your open trade immediately if an opposing “STRONG” signal forms.
Pro Tips for Maximum Accuracy
-
Filter with “STRONG” Signals: Prioritize BANK ENTRY STRONG labels over “WEAK” labels, especially on low timeframes like M1 and M5.
-
Use the Volume Surge Metric: Avoid entering trades when the Vol Surge reading on the top-right dashboard is extremely low—low volume often leads to choppy market movement.
-
Avoid News Spikes: Do not enter new M1 scalps right as high-impact news events (CPI, NFP, FOMC) release to avoid slippage.
Be the first to review “Institutional Smart Money TradingView Indicator”
Related products
-94%
Tradingview
Original price was: $3,999.00.$259.00Current price is: $259.00.
-92%
Tradingview
Original price was: $1,589.00.$129.00Current price is: $129.00.
-89%
-97%
Tradingview
Original price was: $3,999.00.$136.00Current price is: $136.00.
-89%
Tradingview
Original price was: $2,590.00.$280.00Current price is: $280.00.
-96%
Tradingview
Original price was: $3,999.00.$140.00Current price is: $140.00.
-94%


Tradingview
Original price was: $3,958.00.$250.00Current price is: $250.00.
-91%
Tradingview
Original price was: $1,500.00.$132.00Current price is: $132.00.
Reviews
There are no reviews yet.