
-
×
 Super Buy Sell Indicator Tradingview
1 × $250.00
Super Buy Sell Indicator Tradingview
1 × $250.00
-74%
Non-Repainting Smart Reversal Indicator
Original price was: $1,500.00.$395.00Current price is: $395.00.
If you want this indicator then you can pay crypto 299$ (Contact Admin) Click Here
- Original Indicator
- Trading time: Every time
- Instant Download in Zip file
- Working Timeframe: M1 to W1
- Use on Unlimited Tradingview Accounts
- Type of strategy: Scalping and Intraday
- Source Code:- Pine script
- Works on All pairs Forex, Crypto, Stock Marke etc.
- Customer Support & Free Upgrades
- Lifetime Version
 BUY NOW & GET DIGITAL File
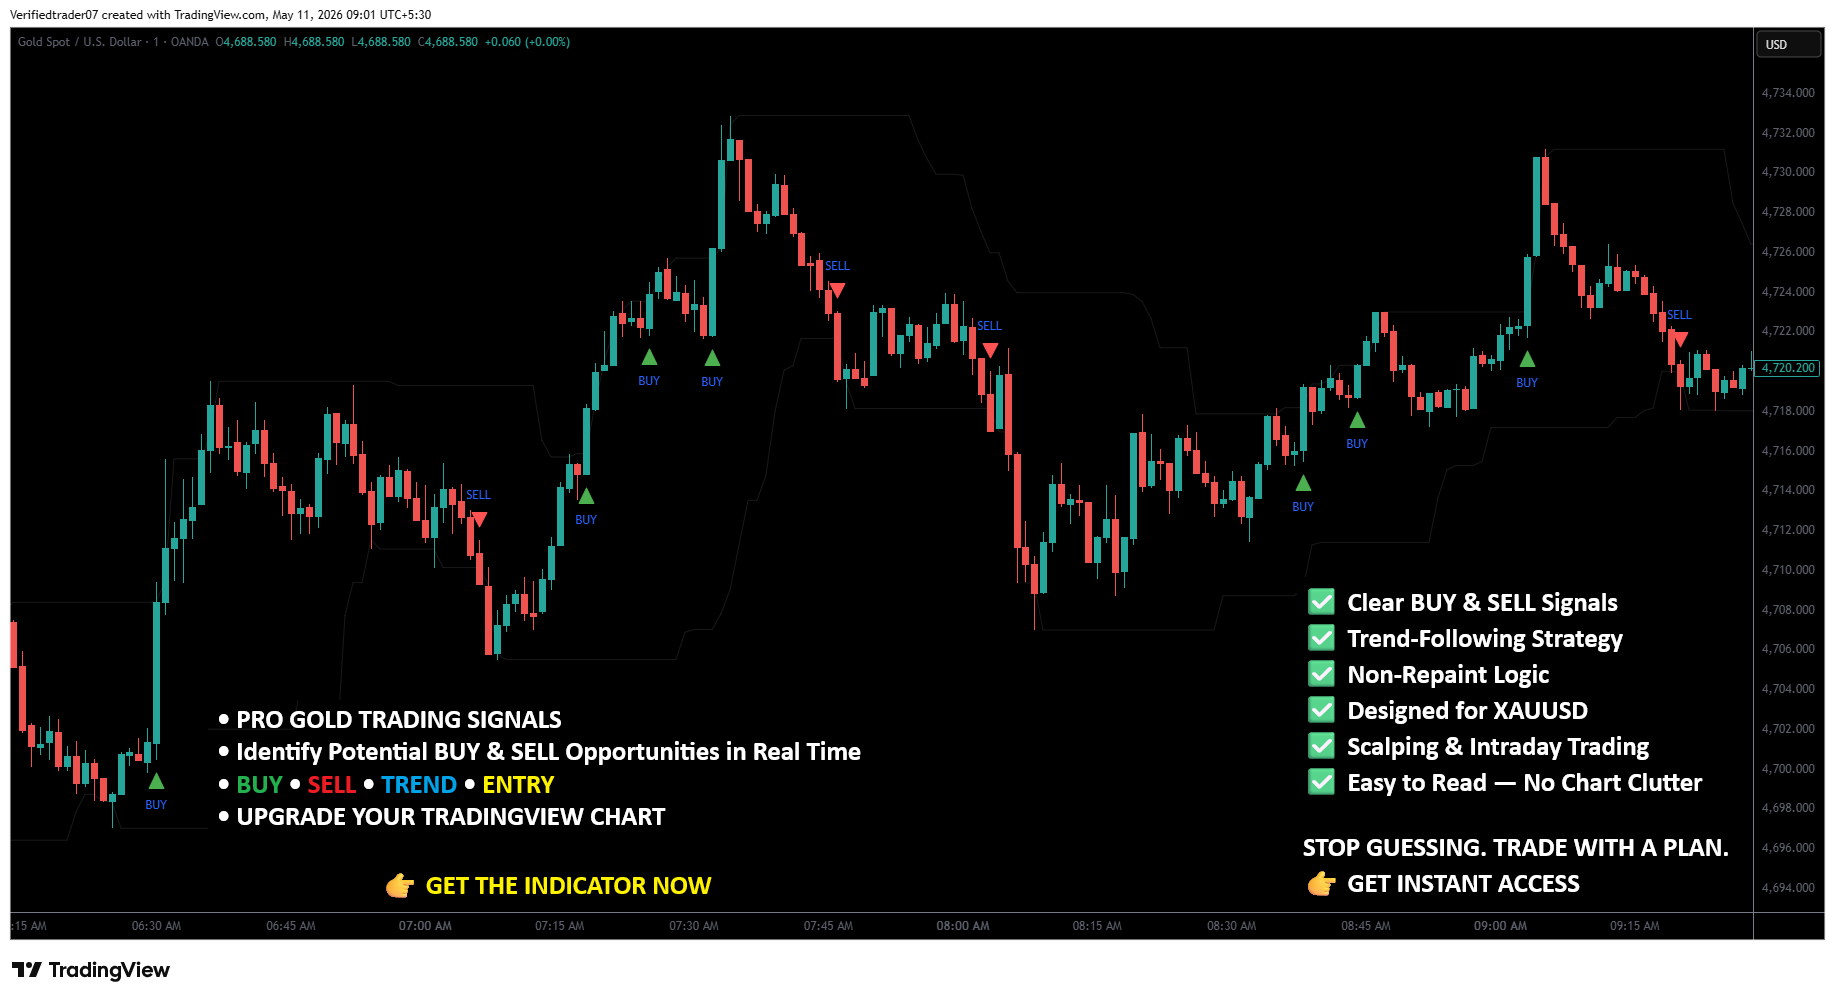
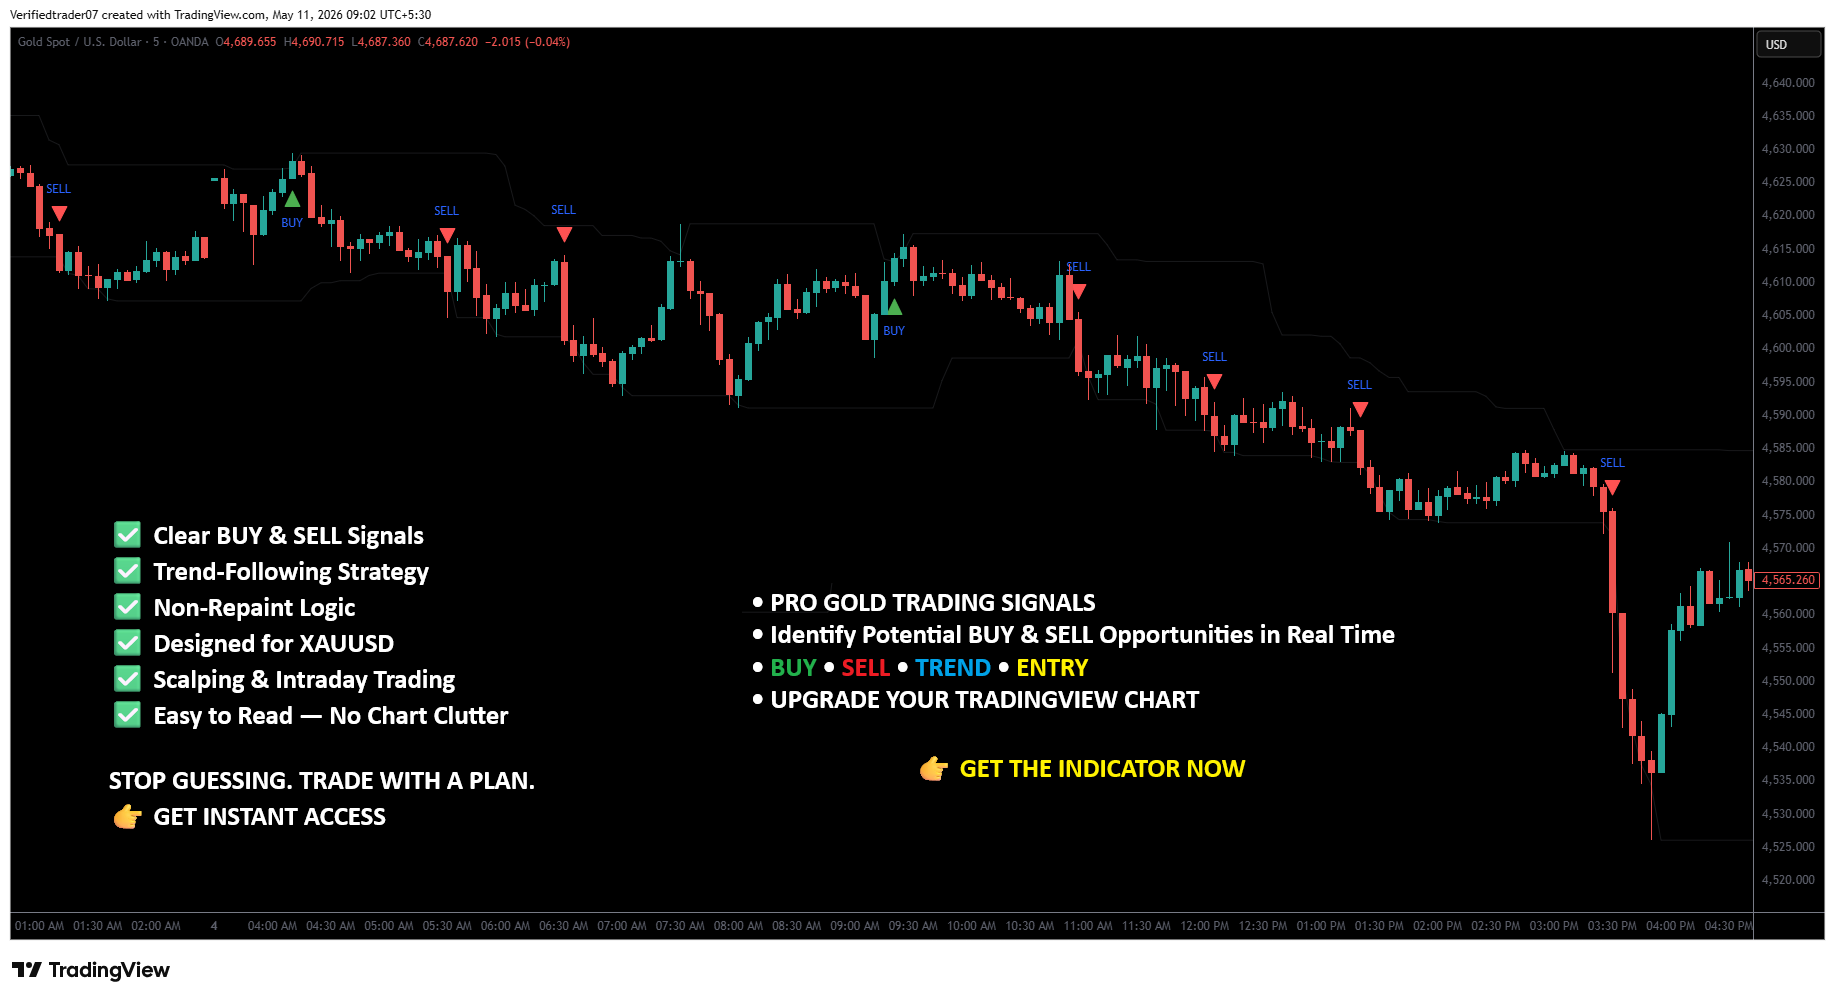
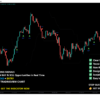
The Pro Gold Trading Signals Indicator shown in the TradingView chart is designed primarily for traders who want a cleaner and easier way to identify potential BUY and SELL opportunities on Gold (XAUUSD). The chart combines price action with clearly visible signal markers, trend information, and a trend-following structure to help traders understand the current market direction.
From the displayed chart, the indicator is specifically presented as a Gold/XAUUSD trading tool with features such as BUY signals, SELL signals, trend-following logic, entry indications, non-repaint logic, and a clean chart interface.
The purpose of this guide is to explain how the indicator works, how to read its signals, how traders can potentially use it for scalping and intraday trading, and how to combine its signals with proper risk management.
What Is the Pro Gold Trading Signals Indicator?
The Pro Gold Trading Signals Indicator is a TradingView-based technical analysis tool created to help traders identify potential market opportunities on Gold Spot / U.S. Dollar (XAUUSD).
Gold can move rapidly, especially during major market sessions and economic news events. Because of this volatility, traders often find it difficult to determine whether the market is currently moving upward, downward, or simply consolidating.
The indicator attempts to simplify this process by visually displaying:
- BUY signals
- SELL signals
- Market direction
- Trend-following information
- Potential entry areas
- Price structure
- Trading zones
- A cleaner visual representation of the market
In the screenshot, BUY signals are represented using green upward arrows, while SELL signals are represented using red downward arrows.
This makes the chart relatively easy to read.
Instead of manually analyzing every candle and trying to determine whether the market is bullish or bearish, the trader can use the indicator as an additional layer of technical analysis.
The main concept is simple:
Green BUY signal → potential bullish opportunity
Red SELL signal → potential bearish opportunity
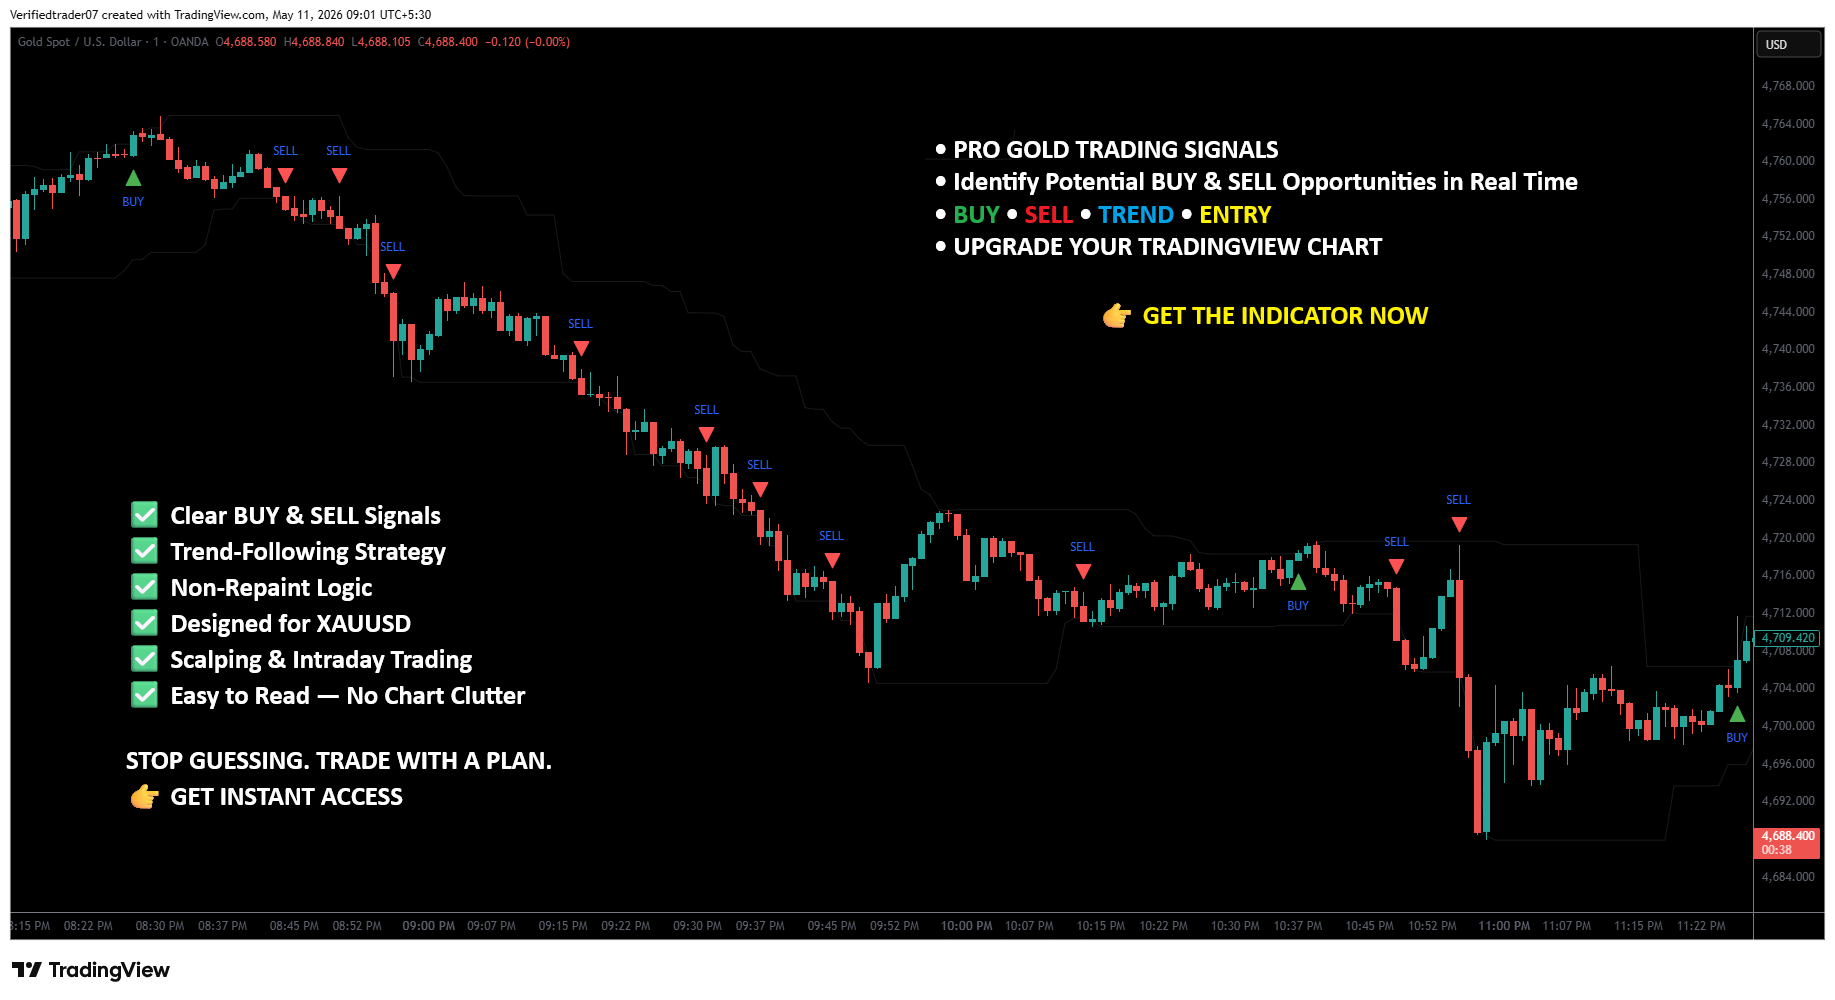
Designed for XAUUSD – Gold Trading
One of the major features highlighted in the image is:
“Designed for XAUUSD.”
This means the indicator is positioned specifically for traders who analyze the Gold vs U.S. Dollar market.
XAUUSD is one of the most actively traded instruments in the forex/CFD market. Gold is popular among scalpers and intraday traders because it can provide significant price movements within relatively short periods.
However, Gold can also be highly volatile.
For example, during important economic announcements, XAUUSD can move hundreds of points very quickly. This means a strategy that looks excellent during normal market conditions may behave differently during major news events.
BUY Signals
The screenshot shows several green BUY arrows appearing below candles.
A BUY signal generally indicates that the indicator has detected conditions that may support a potential upward move.
Green arrow below price = potential BUY opportunity
For example, if Gold has been declining and the indicator prints a green BUY arrow, the trader may begin looking for confirmation that selling pressure is weakening and buyers are returning.
A trader could then evaluate:
- Did the signal appear at an important support area?
- Is the overall trend changing?
- Has the signal candle closed?
- Is the next candle showing bullish momentum?
- Is there sufficient room before the next resistance?
- Is the potential reward greater than the risk?
he chart also displays multiple red SELL arrows above price.
The basic interpretation is:
Red arrow above price = potential SELL opportunity
A SELL signal suggests that the indicator has identified conditions that may support downward movement.
For example, if XAUUSD is moving upward and reaches a resistance area, followed by a SELL signal, a trader may investigate whether the market is showing signs of rejection or reversal.
Before entering, traders can look for confirmation such as:
- Bearish candlestick formation
- Resistance rejection
- Lower high formation
- Break of short-term support
- Weakening bullish momentum
- Overall bearish market structure
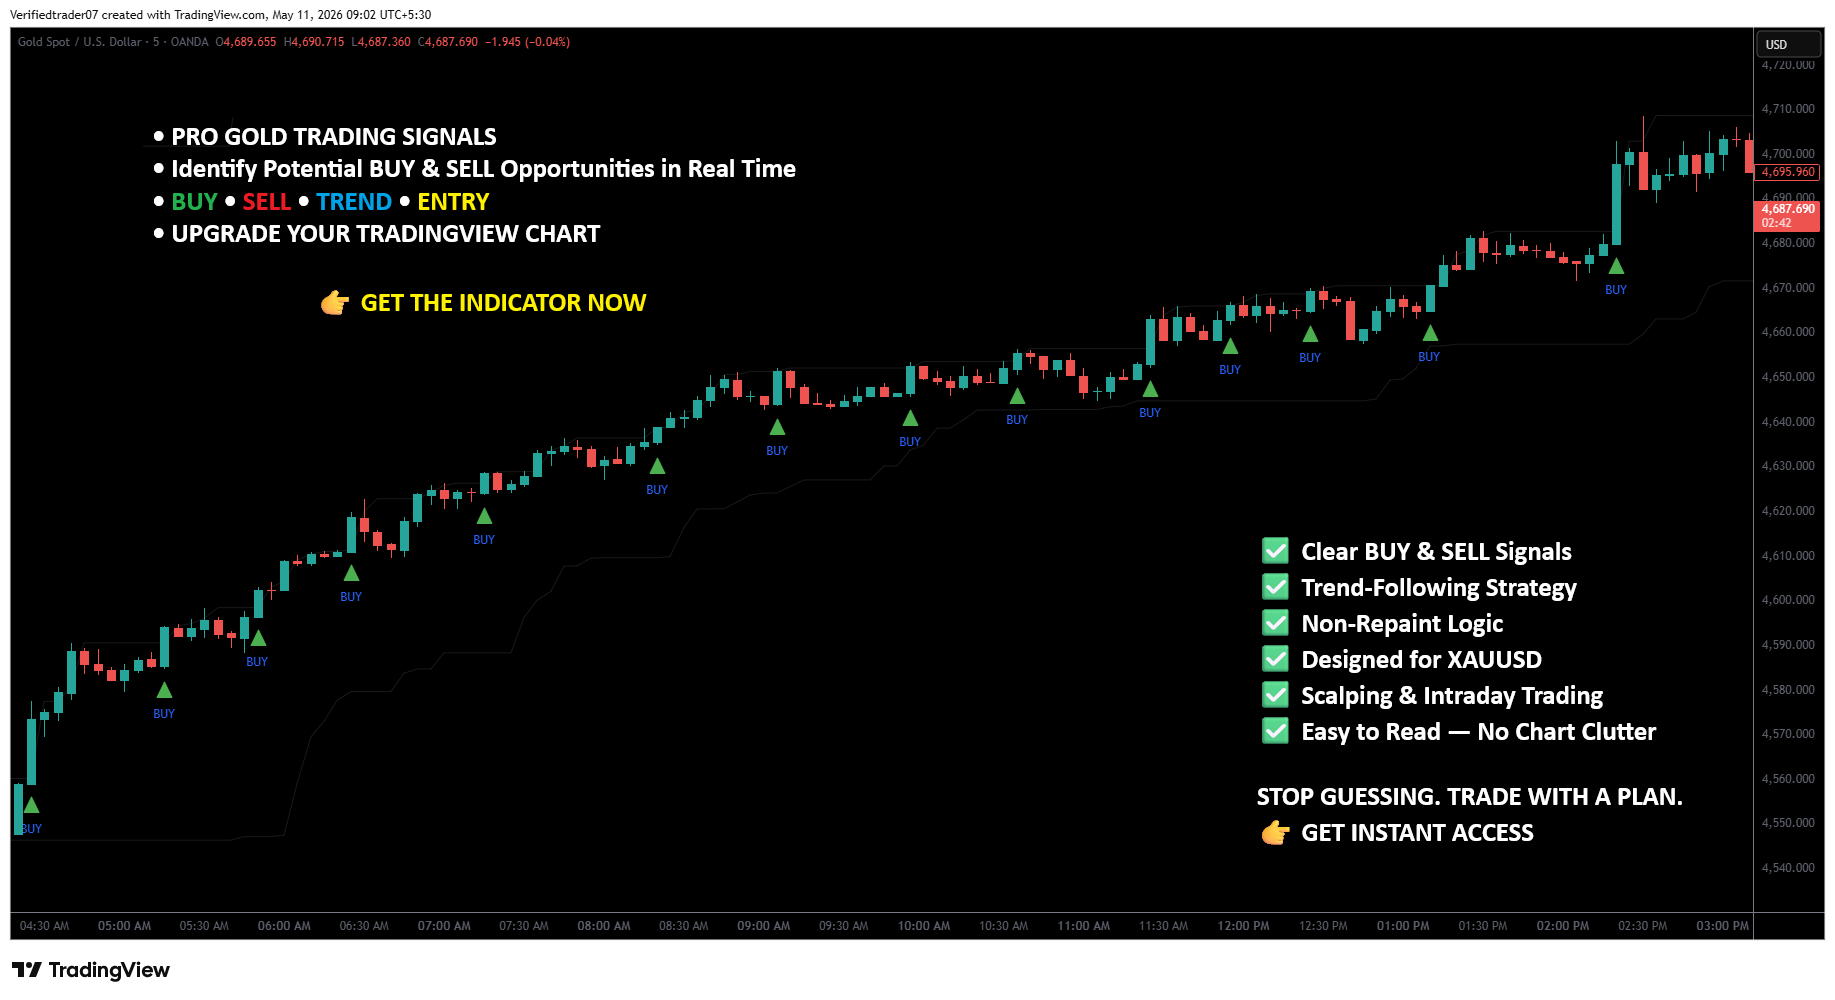
Understanding the Trend-Following Structure
The screenshot shows a dark line/structure surrounding portions of the price movement.
The indicator description identifies the system as a:
“Trend-Following Strategy.”
Trend-following strategies attempt to identify the direction in which the market is currently moving and then look for opportunities to trade in that direction.
For example:
Bullish Environment
If Gold is making:
- Higher highs
- Higher lows
- Strong bullish candles
then BUY signals may receive greater attention.
Bearish Environment
If Gold is making:
- Lower highs
- Lower lows
- Strong bearish candles
then SELL signals may receive greater attention.
This is an important concept because traders generally have two choices:
Trade with the trend
or
Trade against the trend
For many traders, trading with the prevailing trend can be easier to manage than attempting to predict every reversal.
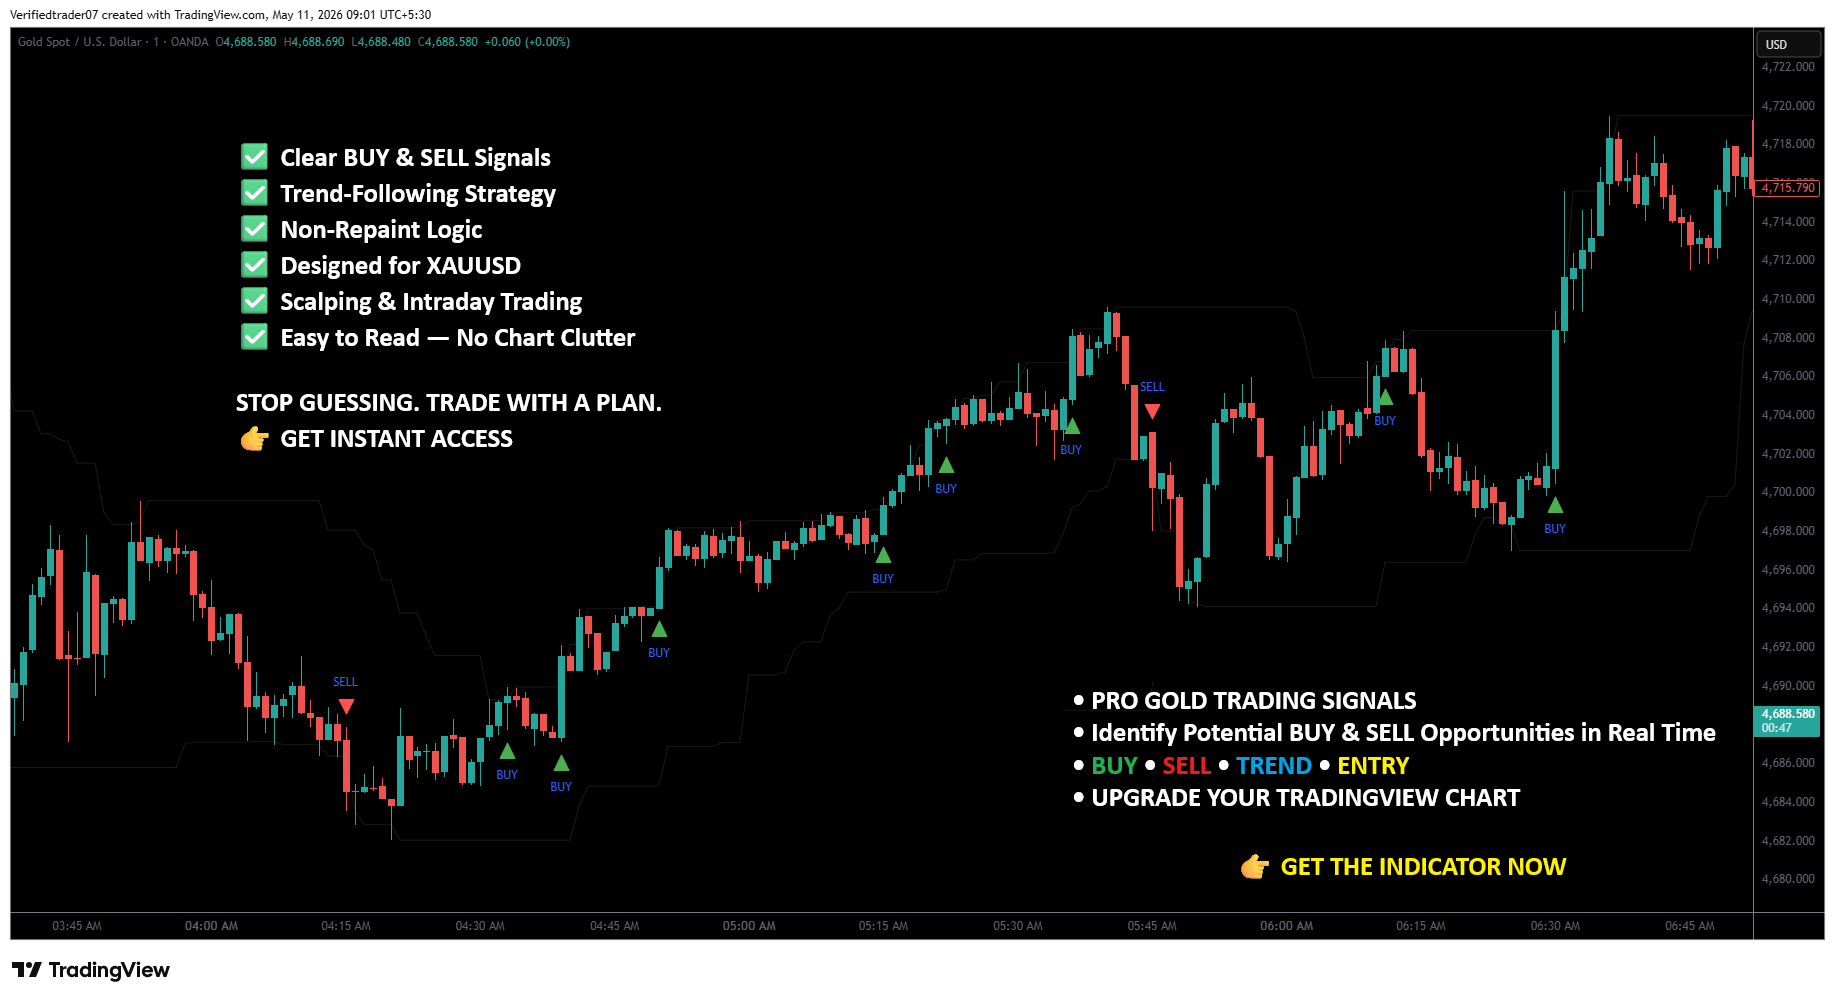
Non-Repaint Logic
One of the most important features highlighted in the image is:
“Non-Repaint Logic.”
For trading indicators, repainting is an important topic.
A repainting indicator can potentially change historical signals after additional market data becomes available. This can make historical charts appear much better than the signals that were actually available in real time.
A non-repainting approach is intended to prevent previously confirmed signals from changing after the relevant candle has closed.
However, there is an important distinction:
Signal Before Candle Close
A signal may appear while a candle is still forming.
Because the candle’s price is changing, the conditions can potentially change before the candle closes.
Signal After Candle Close
Once the signal candle has completely closed, a properly designed non-repainting system should not move or remove that confirmed historical signal because of future candles.
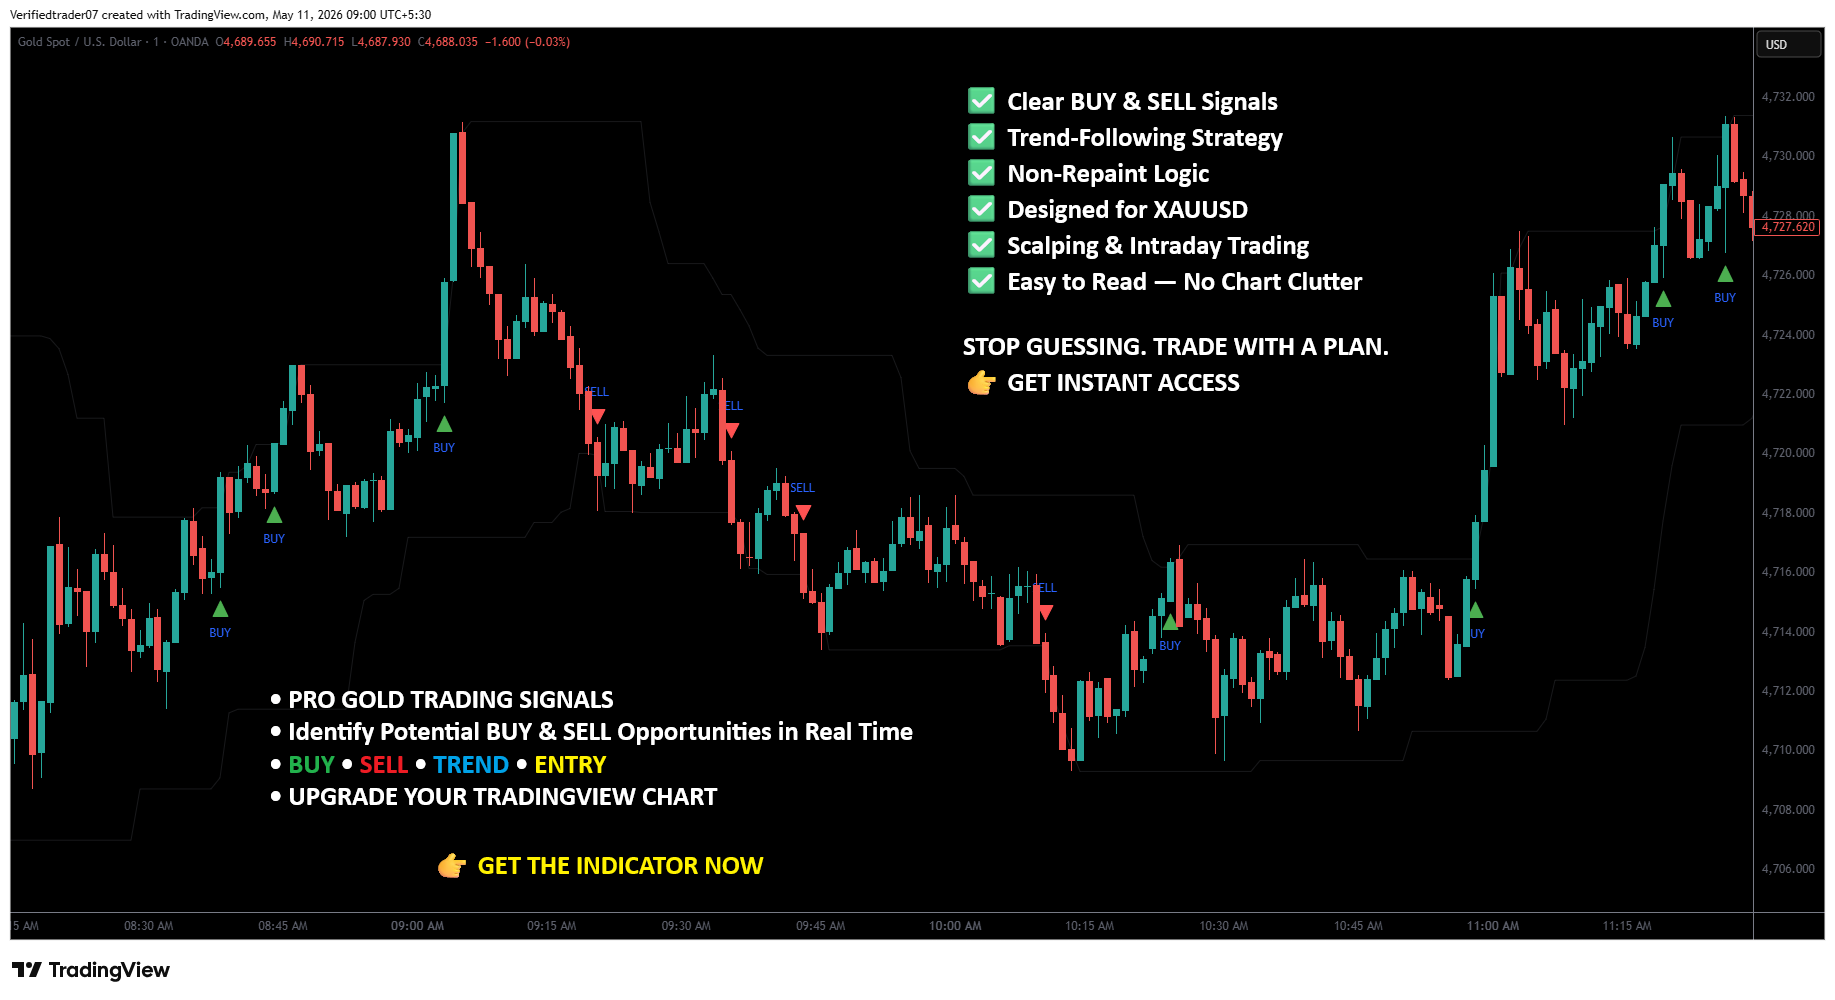
Entry Strategy
The screenshot emphasizes:
BUY • SELL • TREND • ENTRY
The indicator is therefore designed to make the entry process visually simple.
A basic entry methodology can be:
BUY
- Green BUY arrow appears.
- Wait for candle close.
- Confirm bullish conditions.
- Identify recent swing low.
- Place or plan BUY entry.
- Set Stop Loss.
- Set Take Profit.
- Manage the position according to the trading plan.
SELL
- Red SELL arrow appears.
- Wait for candle close.
- Confirm bearish conditions.
- Identify recent swing high.
- Plan SELL entry.
- Set Stop Loss.
- Set Take Profit.
- Manage the position according to the trading plan.
Be the first to review “Non-Repainting Smart Reversal Indicator”
Related products
-90%

Tradingview
Original price was: $1,500.00.$145.00Current price is: $145.00.
-97%
Tradingview
Original price was: $3,999.00.$136.00Current price is: $136.00.
-92%
Tradingview
Original price was: $1,999.00.$150.00Current price is: $150.00.
-92%
Tradingview
Original price was: $1,589.00.$129.00Current price is: $129.00.
-88%
Tradingview
Original price was: $2,590.00.$299.00Current price is: $299.00.
-96%
Tradingview
Original price was: $3,999.00.$140.00Current price is: $140.00.
-89%
-65%
MT4 Indicator
Original price was: $399.00.$139.00Current price is: $139.00.
Reviews
There are no reviews yet.