
-
×
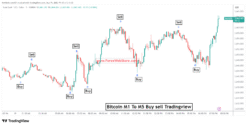 Bitcoin M1 To M5 Buy sell Tradingview
1 × $259.00
Bitcoin M1 To M5 Buy sell Tradingview
1 × $259.00 -
×
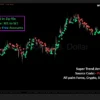
 Super Trend Arrow Indicator | 100% Non Repaint Indicator V11.0
1 × $249.00
Super Trend Arrow Indicator | 100% Non Repaint Indicator V11.0
1 × $249.00 -
×
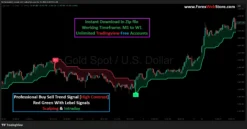
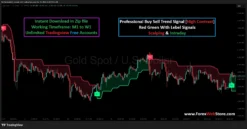 Professional Buy Sell Trend Signal [High Contrast]
1 × $145.00
Professional Buy Sell Trend Signal [High Contrast]
1 × $145.00
-90%

Trend Strength Signal Pro

Original price was: $1,500.00.$145.00Current price is: $145.00.
- Original Indicator
- Trading time: Every time
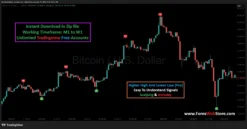
- Instant Download in Zip file
- Working Timeframe: M1 to W1
- Use on Unlimited Tradingview Accounts
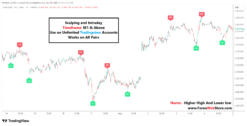
- Type of strategy: Scalping and Intraday
- Source Code:- Pine script
- Works on All pairs Forex, Crypto, Stock Marke etc.
- Customer Support & Free Upgrades
- Lifetime Version
Trend Strength Signal Pro Indicator
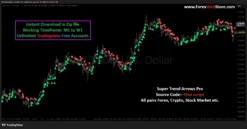
The Trend Strength Signal Pro Indicator is a powerful trading tool designed to help traders identify accurate buy and sell opportunities in the market. This indicator analyzes price movement and market momentum to display clear buy arrows and sell arrows directly on the chart, making it easier for traders to understand market direction without complex technical analysis. It works especially well for short-term trading strategies and is commonly used by traders who focus on fast market movements such as those found in the XAGUSD market.
The indicator is compatible with the popular charting platform TradingView and can be used across multiple timeframes. Whether you are a beginner or an experienced trader, the indicator simplifies trading decisions by highlighting potential trend reversals and continuation opportunities with visual signals.
Understanding the Indicator Signals
The Trend Strength Signal Pro indicator provides two primary signals on the chart:
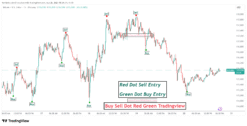
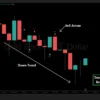
Buy Arrow (Green Arrow)
The green buy arrow appears below a candle when the indicator detects that the market may start moving upward. This signal indicates a potential bullish reversal or the start of an upward trend.
Sell Arrow (Red Arrow)
The red sell arrow appears above a candle when the indicator detects potential downward momentum. This signal suggests that the market may begin moving lower or continue an existing bearish trend.
These signals are based on trend strength analysis, momentum shifts, and price structure. By combining these elements, the indicator attempts to provide traders with clear visual entry points.
![]()
Step-by-Step Guide to Using the Indicator
Step 1: Install the Indicator on Your Chart
First, open your chart on TradingView and select the market you want to trade. Many traders prefer using this indicator on highly volatile markets such as XAGUSD because the price movements are strong and frequent.
After installing the indicator on the chart, you will immediately start seeing buy and sell arrows appearing near candles. These arrows represent potential entry points based on the indicator’s analysis.
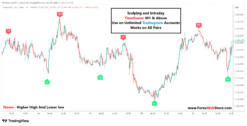
Step 2: Choose the Right Timeframe
The indicator works on multiple timeframes, ranging from 1 minute to higher timeframes like H1 or H4. However, the best timeframe depends on your trading style.
For example:
- 1 Minute to 5 Minute: Best for scalping and fast trades
- 15 Minute to 30 Minute: Suitable for intraday trading
- 1 Hour and above: Ideal for swing trading
Many traders prefer the M5 and M15 timeframes because they provide a good balance between signal frequency and reliability.
Buy Trade Setup
A buy trade should be considered when the indicator generates a green buy arrow below a candle.
Buy Entry Rules
- Wait for a green buy arrow to appear on the chart.
- Make sure the candle closes before entering the trade.
- Confirm that the market is near a support level or recent swing low.
- Enter the buy trade on the next candle.
Waiting for candle confirmation helps reduce the chances of entering false signals.

Stop Loss Placement for Buy Trades
To protect your capital, always place a stop loss.
For buy trades:
- Place the stop loss below the previous swing low.
- Alternatively, place it a few pips below the signal candle.
This ensures that if the market continues moving downward, the loss remains limited.
Take Profit Strategy for Buy Trades
Take profit levels can be determined using several methods:
- The nearest resistance level
- Previous market highs
- A risk-to-reward ratio of 1:2 or 1:3
For example, if your stop loss is 20 pips, your take profit should ideally be 40–60 pips.
Sell Trade Setup
A sell trade should be taken when the indicator shows a red sell arrow above a candle.
Sell Entry Rules
- Wait for the red sell arrow signal.
- Confirm the signal with candle close.
- Check if price is near a resistance level or previous swing high.
- Enter the sell trade on the next candle.
This approach allows traders to enter the market after confirmation rather than reacting too quickly.

Stop Loss Placement for Sell Trades
For sell trades, the stop loss should be placed:
- Above the recent swing high, or
- Slightly above the signal candle
This prevents large losses if the market suddenly reverses.
Take Profit Strategy for Sell Trades
Take profit for sell trades can be placed at:
- The nearest support level
- Previous market lows
- A risk-to-reward ratio of 1:2 or higher
Maintaining a proper risk-reward ratio is important for long-term profitability.
Understanding the Trend Strength Panel
The indicator also provides a trend strength panel that shows useful information about the market.
This panel may include details such as:
- Current trading pair
- Current timeframe
- Trend direction
- Trend strength percentage
- Latest trading signal
For example, if the panel shows trend direction: down and last signal: sell, it means the market is currently favoring bearish momentum.
Traders can use this information to confirm their trades and avoid entering positions against the overall trend.

Risk Management Strategy
Successful trading requires more than just good signals. Proper risk management is essential for protecting your account.
Professional traders often follow the 1–2% rule, meaning they risk only a small percentage of their account on each trade.
For example:
- Trading account balance: $500
- Maximum risk per trade: $5 to $10
By limiting risk, traders can survive losing streaks and continue trading consistently.
Best Markets for This Indicator
Although the indicator works on multiple markets, it tends to perform best on volatile instruments.
Some popular markets include:
- XAGUSD
- XAUUSD
- EURUSD
- GBPUSD
These markets typically produce stronger trends and clearer signals.
Advantages of Trend Strength Signal Pro
There are several reasons why many traders prefer this indicator:
Clear visual signals
The buy and sell arrows make it easy to understand when trading opportunities appear.
Works on multiple timeframes
The indicator can be used for scalping, day trading, or swing trading.
Simple trading rules
Even beginners can quickly learn how to use the indicator.
Trend strength analysis
The indicator evaluates market momentum and trend direction.
Compatible with TradingView
It works smoothly with the TradingView interface.

Tips for Better Results
To increase the accuracy of your trades, consider combining this indicator with additional tools such as:
- Support and resistance levels
- Trendlines
- Moving averages
- Price action patterns
For example, if a buy arrow appears near a strong support level, the probability of a successful trade increases.
Similarly, if a sell arrow appears near resistance, the chance of a downward move becomes higher.
Common Trading Mistakes to Avoid
Many traders make mistakes when using signal indicators. Avoid the following:
Taking every signal
Not every signal will result in profit. Always wait for confirmation.
Ignoring market trend
Trading against the main trend increases risk.
Using large lot sizes
Over-leveraging can quickly wipe out your account.
Skipping stop loss
Always protect your trades with a stop loss.
Final Thoughts
The Trend Strength Signal Pro Indicator is designed to simplify the trading process by identifying potential buy and sell opportunities directly on the chart. By following the proper entry rules, confirming signals with market structure, and applying strict risk management, traders can use this indicator to improve their trading discipline and decision-making.
When used correctly, the indicator can become a valuable tool for identifying market trends and capturing profitable trading opportunities in markets such as XAGUSD and other major forex pairs.
Be the first to review “Trend Strength Signal Pro”
Related products
-95%
Tradingview
Original price was: $4,782.00.$250.00Current price is: $250.00.
-94%
Tradingview
Original price was: $3,999.00.$226.00Current price is: $226.00.
-96%

Tradingview
Original price was: $3,999.00.$141.00Current price is: $141.00.
-94%


Tradingview
Original price was: $3,958.00.$250.00Current price is: $250.00.
-92%
Tradingview
Original price was: $1,999.00.$150.00Current price is: $150.00.
-90%
Original price was: $1,500.00.$145.00Current price is: $145.00.
-89%
-90%


Tradingview
Original price was: $1,999.00.$199.00Current price is: $199.00.
Reviews
There are no reviews yet.