
-
×
 Buy Sell Super Trend Tradingview
1 × $141.00
Buy Sell Super Trend Tradingview
1 × $141.00 -
×
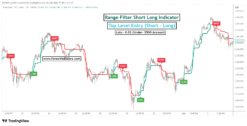 Range Filter Short Long Indicator
1 × $150.00
Range Filter Short Long Indicator
1 × $150.00 -
×
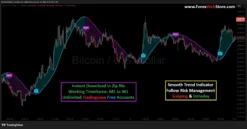 Smooth Trend Indicator
1 × $166.00
Smooth Trend Indicator
1 × $166.00 -
×
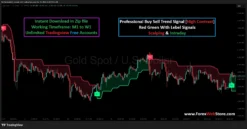 Professional Buy Sell Trend Signal [High Contrast]
1 × $145.00
Professional Buy Sell Trend Signal [High Contrast]
1 × $145.00 -
×
 Buy Sell ICT Tradingview Indicator
1 × $199.00
Buy Sell ICT Tradingview Indicator
1 × $199.00
-88%
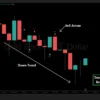
Visual Trend Pivot System
Original price was: $3,999.00.$480.00Current price is: $480.00.
- Original Indicator
- Trading time: Every time
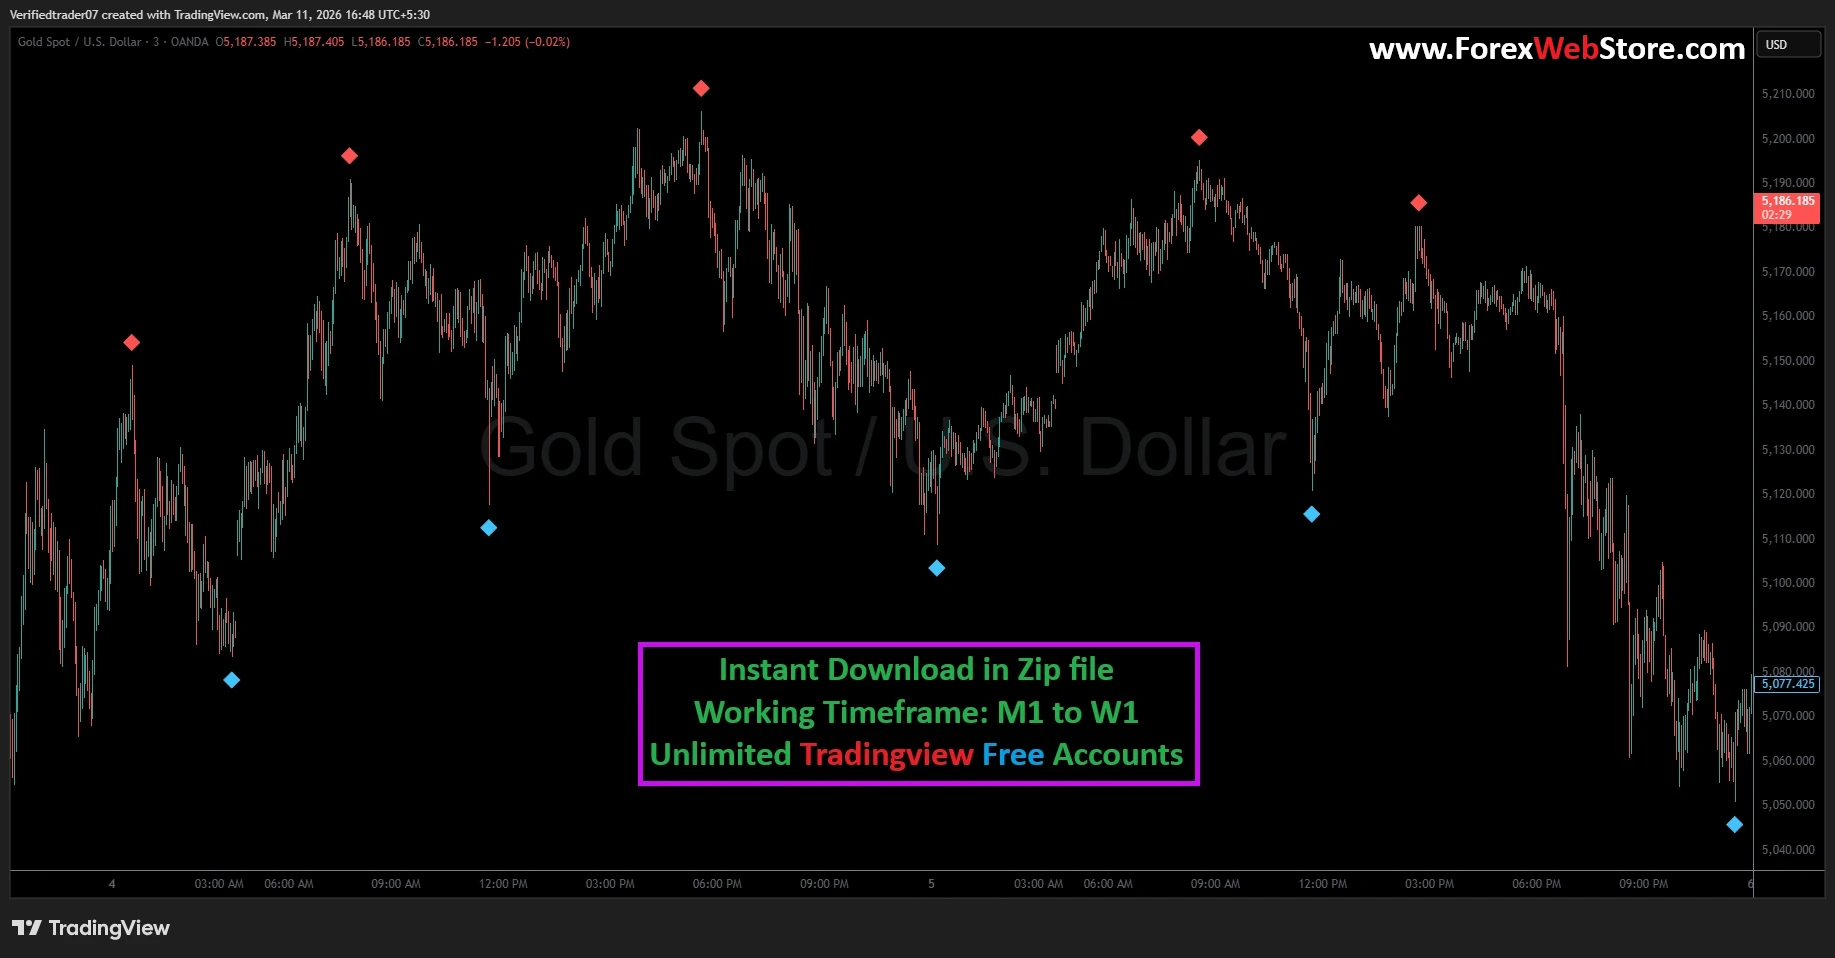
- Instant Download in Zip file
- Working Timeframe: M1 to W1
- Use on Unlimited Tradingview Accounts
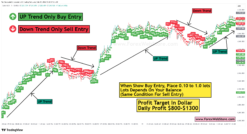
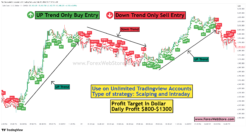
- Type of strategy: Scalping and Intraday
- Source Code:- Pine script
- Works on All pairs Forex, Crypto, Stock Marke etc.
- Customer Support & Free Upgrades
- Lifetime Version
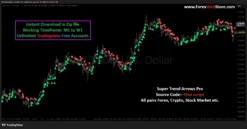
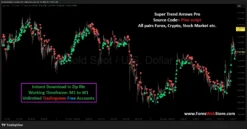
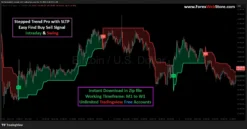
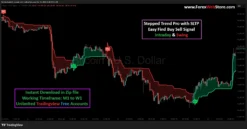
What This Indicator Shows
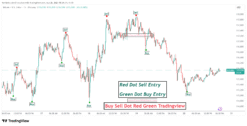
This indicator automatically scans price action and identifies swing highs and swing lows. When the market forms a potential top, the indicator prints a red diamond above the candle. This suggests that the upward movement may be weakening and a possible sell opportunity could appear. When the market forms a potential bottom, the indicator prints a blue diamond below the candle. This suggests that the downward movement may be ending and a possible buy opportunity could appear.
Because the signals appear directly on the chart, traders can quickly understand where price reversals may occur without manually analyzing every swing point.
How to Use This Indicator (Step-by-Step Guide)
Step 1: Add the Indicator to Your Chart
First, open your charting platform such as TradingView and select the market you want to trade. Many traders prefer trading gold (XAUUSD) because of its strong volatility and clear price movements. After opening the chart, install the indicator and apply it to your chart. Once activated, you will see red and blue diamond signals appearing above and below candles.
The indicator works on multiple timeframes from M1 (1-minute) to W1 (weekly). However, many traders find the best results on M5, M15, M30, and H1 timeframes because these provide a balance between signal frequency and accuracy.

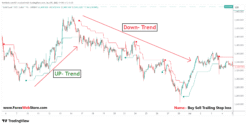
Step 2: Identify the Market Trend
Before taking any trade signal, always check the overall market trend. The indicator works best when signals are traded in the direction of the larger trend.
You can identify the trend by observing price structure:
- Uptrend: Higher highs and higher lows
- Downtrend: Lower highs and lower lows
- Sideways market: Price moving inside a range
If the market is in a strong uptrend, focus mainly on buy signals (blue diamonds). If the market is in a strong downtrend, focus on sell signals (red diamonds). Avoid trading against a strong trend unless there is clear reversal confirmation.
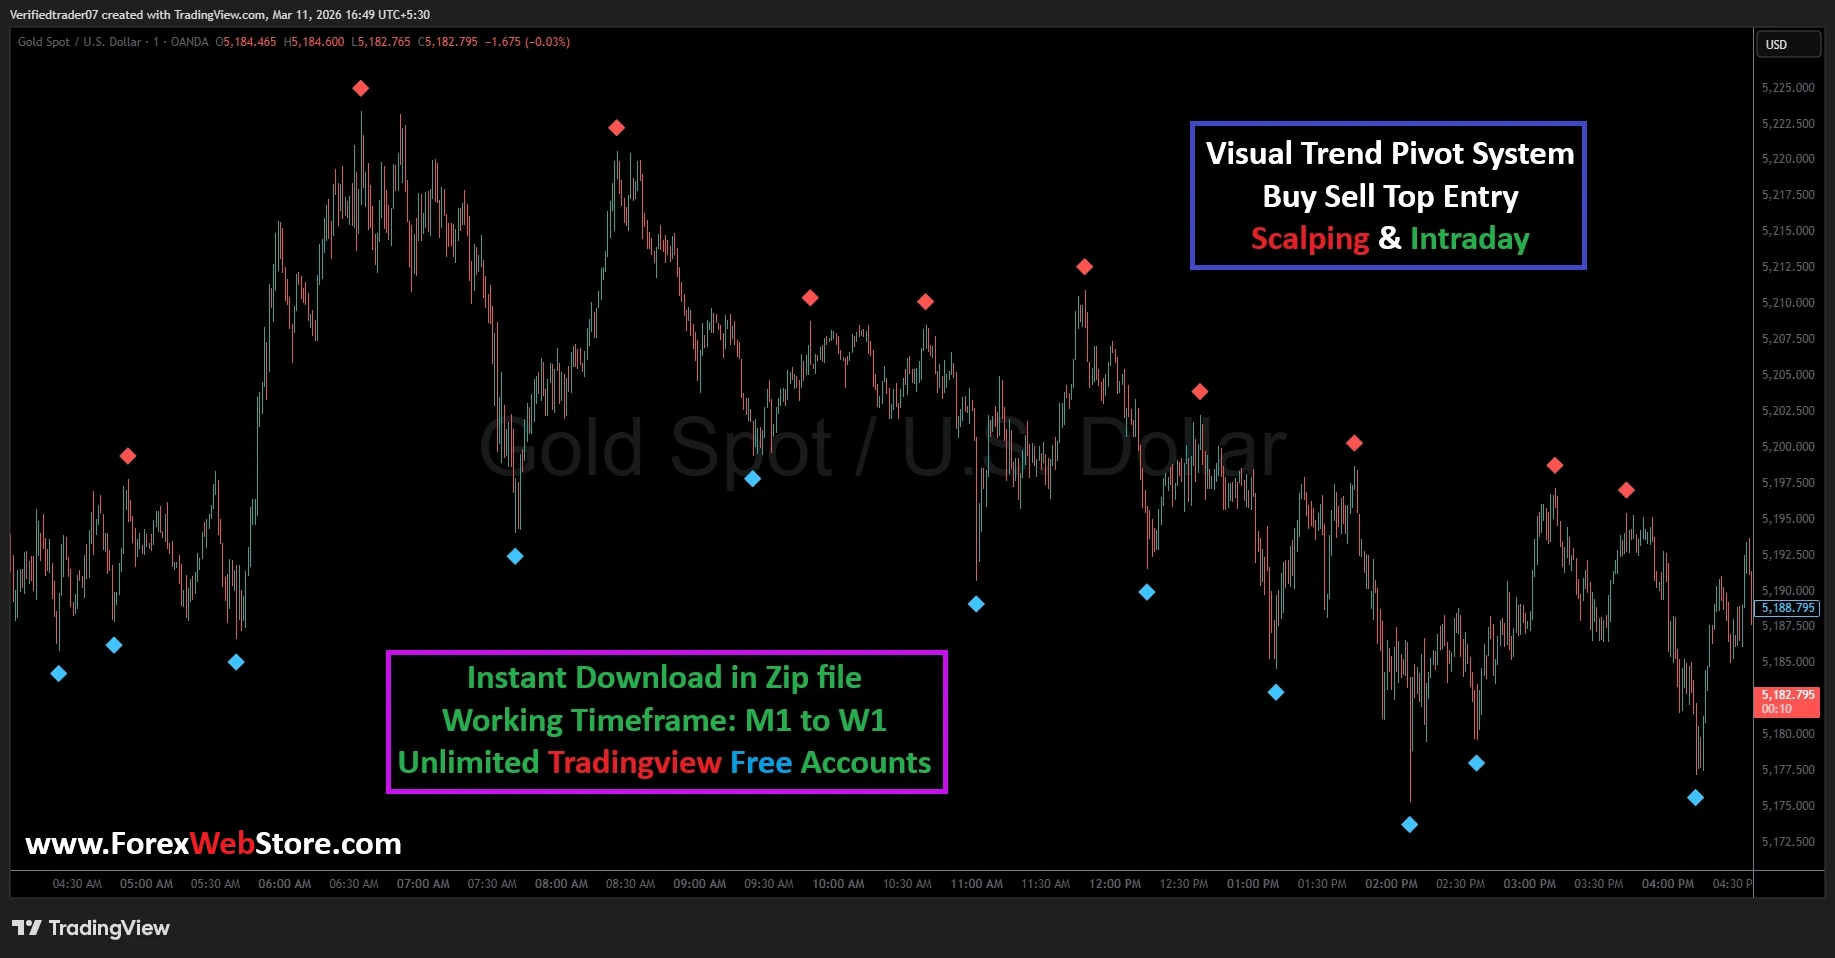
Buy Entry Strategy
A buy trade occurs when the indicator shows a blue diamond signal below the candle, indicating a possible bullish reversal.
Entry Rules
- Wait for a blue diamond signal to appear under the candle.
- Confirm that price is near a support level or previous swing low.
- Wait for the candle to close to confirm the signal.
- Enter a Buy trade on the next candle.
This method helps traders avoid entering the trade too early and reduces the risk of false signals.
Stop Loss for Buy Trade
For proper risk protection, place the Stop Loss below the most recent swing low or a few pips below the signal candle. This ensures that if the market continues moving downward, the loss remains limited.
Take Profit for Buy Trade
Take profit can be placed at:
- The next resistance level
- A risk-reward ratio of 1:2
- Previous swing highs
For example, if your stop loss is 20 pips, your take profit should be around 40 pips to maintain a good risk-to-reward ratio.

Sell Entry Strategy
A sell trade occurs when the indicator shows a red diamond signal above the candle, indicating a possible bearish reversal.
Entry Rules
- Wait for a red diamond signal above the candle.
- Confirm that price is near a resistance level or previous swing high.
- Wait for the signal candle to close.
- Enter a Sell trade on the next candle.
This confirmation step helps traders avoid entering trades based on temporary price spikes.
Stop Loss for Sell Trade
Place the Stop Loss above the most recent swing high or slightly above the signal candle. This protects your account if the market continues moving upward.
Take Profit for Sell Trade
You can place take profit at:
- The nearest support level
- A 1:2 or 1:3 risk-reward ratio
- The previous swing low
Using these targets allows traders to lock in profits before the market changes direction.
Risk Management Strategy
Risk management is one of the most important aspects of successful trading. Even the best indicator cannot guarantee a 100% win rate, so managing risk properly is essential.
A common rule used by professional traders is the 1-2% risk rule. This means that you should never risk more than 1–2% of your total trading account on a single trade.
For example:
- Account Balance: $500
- Maximum Risk per Trade: $5 to $10
This approach ensures that even if multiple trades lose consecutively, your account will remain protected.
Best Currency Pairs for This Indicator
Although this indicator can be used on many markets, it tends to perform better on high-volatility instruments. Some of the most popular pairs include:
- XAUUSD
- EURUSD
- GBPUSD
- USDJPY
Gold is particularly popular because it often produces strong and fast price movements, which can generate larger profit opportunities.
Best Timeframes to Use
The indicator supports multiple timeframes, but traders typically prefer the following:
| Timeframe | Trading Style |
|---|---|
| M1 – M5 | Scalping |
| M15 – M30 | Intraday trading |
| H1 – H4 | Swing trading |
| D1 – W1 | Position trading |
For beginners, the M15 and H1 timeframes are often recommended because they provide clearer signals and less market noise.

Additional Confirmation Tips
To improve accuracy, many traders combine this indicator with additional tools such as:
- Support and resistance levels
- Trendlines
- Moving averages
- Price action patterns
For example, if a blue diamond appears at a strong support zone, the probability of a successful buy trade increases significantly.
Similarly, if a red diamond appears near resistance, the market may reverse downward.
Advantages of This Indicator
This indicator offers several benefits for traders:
- Clear visual signals – Easy to understand for beginners.
- Works on multiple timeframes – From scalping to swing trading.
- Suitable for multiple markets – Forex, gold, and indices.
- Helps identify reversal points – Useful for catching early trend changes.
- Simple trading rules – No complex calculations required.
Because of these advantages, many traders prefer using this type of indicator for quick decision-making and automated signal identification.

Common Mistakes to Avoid
Many beginner traders make mistakes when using signal indicators. Avoid the following:
1. Trading every signal
Not every signal will be profitable. Always wait for confirmation.
2. Ignoring the trend
Trading against a strong trend increases risk.
3. Using large lot sizes
Over-leveraging can quickly destroy an account.
4. Skipping stop loss
Always protect your capital with a stop loss.
Final Thoughts
This indicator is designed to simplify trading by highlighting potential buy and sell reversal points directly on the chart. By following the correct strategy—waiting for signal confirmation, using proper stop loss placement, and maintaining strong risk management—traders can use this tool to improve their trading discipline and decision-making process.
When combined with price action, support and resistance levels, and proper money management, this indicator can become a powerful addition to any trading strategy. Whether you are trading gold, forex pairs, or other financial instruments, the indicator helps identify key market turning points and provides a structured approach to entering and exiting trades.
6 reviews for Visual Trend Pivot System
Add a review
Related products
-90%
Tradingview
Original price was: $1,500.00.$150.00Current price is: $150.00.
-99%
Tradingview
Original price was: $20,000.00.$180.00Current price is: $180.00.
-89%
-92%
Tradingview
Original price was: $1,589.00.$129.00Current price is: $129.00.
-96%
Tradingview
Original price was: $3,999.00.$141.00Current price is: $141.00.
-90%

Tradingview
Original price was: $1,999.00.$199.00Current price is: $199.00.
-87%
Tradingview
Original price was: $1,500.00.$199.00Current price is: $199.00.
-92%
Tradingview
Original price was: $1,999.00.$150.00Current price is: $150.00.

Natalija Ugrina –
I’ve tried many paid indicators, but this Gold M1 indicator gives very fast signals. It’s especially helpful for scalping. With proper risk management, consistent profit is possible.
Admin –
thanks
Jessica monica –
The indicator is good and the buy/sell arrows are clear. But don’t rely on it blindly combine it with price action for better results.
Admin –
your choise sir
Ropiah Rop –
This indicator completely changed my scalping game. The entries are precise, and I’m now more confident trading Gold on the M1 timeframe.
Admin –
sir trading is not a game, this is business. use proper risk manage
Leonard Welch –
It only works Forex, Crypto, Stock Market, when I’m Rwanda.
John maxs –
Hello how to purchase this indicator any discount
Admin –
Use Code :- useme25
John max –
How to purchase this indicator
Admin –
Use Your Debit cards or cradit cards