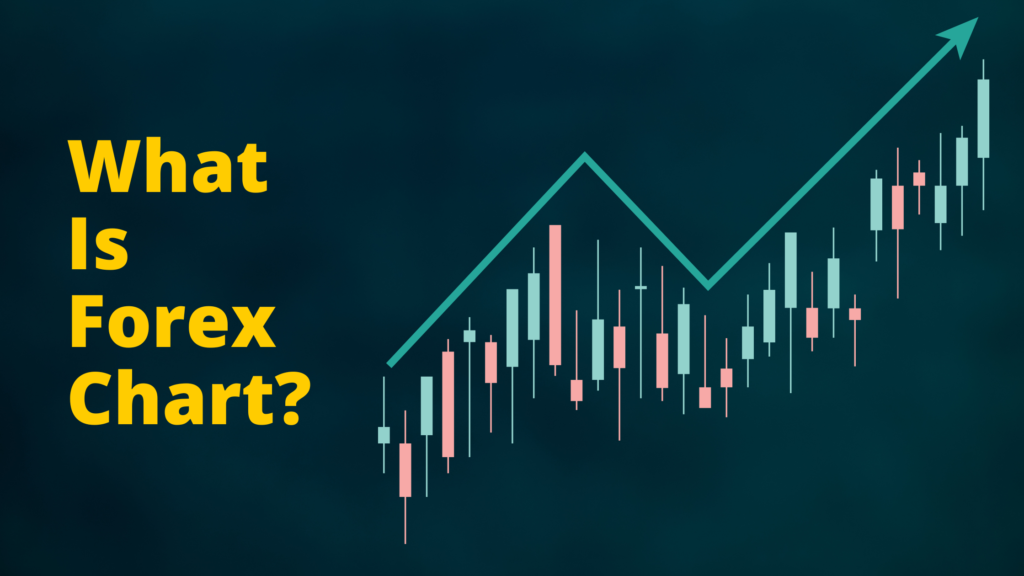
A forex chart is a graphical representation of the price movement of a currency pair over a specific period of time. It is a fundamental tool used by forex traders to analyze and make decisions based on historical price data. Forex charts display the relationship between two currencies, with the base currency on the left […]

