
Blog
What is forex chart?
Jun
A forex chart is a graphical representation of the price movement of a currency pair over a specific period of time. It is a fundamental tool used by forex traders to analyze and make decisions based on historical price data.
Forex charts display the relationship between two currencies, with the base currency on the left and the quote currency on the right. The vertical axis of the chart represents the price scale, while the horizontal axis represents the time scale.
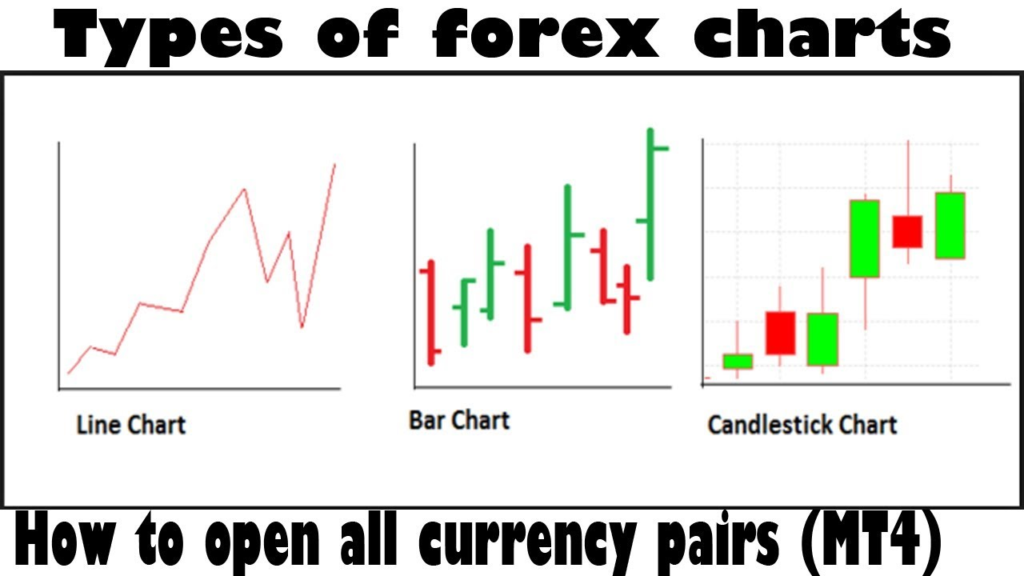
There are several types of forex charts available, including:
- Line Chart: This is the simplest type of chart that connects the closing prices of each period with a line. It provides a basic overview of the price trend but lacks detailed information about the price action within each period.
- Bar Chart: This chart displays vertical bars for each period, representing the price range from the highest to the lowest point. The opening price is shown as a small horizontal line on the left side of the bar, while the closing price is shown as a small horizontal line on the right side of the bar.
- Candlestick Chart: This chart is similar to the bar chart but uses candlestick patterns to represent price movements. Each candlestick consists of a rectangular body and wicks (or shadows) extending from the top and bottom of the body. The body represents the price range between the opening and closing prices, while the wicks indicate the high and low prices during the period.
- Heiken Ashi Chart: This chart is a variation of the candlestick chart that aims to filter out some of the market noise. It uses modified candlestick calculations to provide a smoother representation of price trends.
Forex charts can be displayed in different timeframes, such as minutes, hours, days, weeks, or months. Traders use these charts to analyze price patterns, identify trends, support and resistance levels, and apply various technical indicators to make informed trading decisions.
It’s important to note that forex charts are historical representations of price data and do not guarantee future price movements. Traders often combine chart analysis with other forms of market analysis and risk management strategies to increase their chances of making profitable trades.