
Free Indicator
Heiken Ashi / Momentum Color Candle Trend System.
Feb
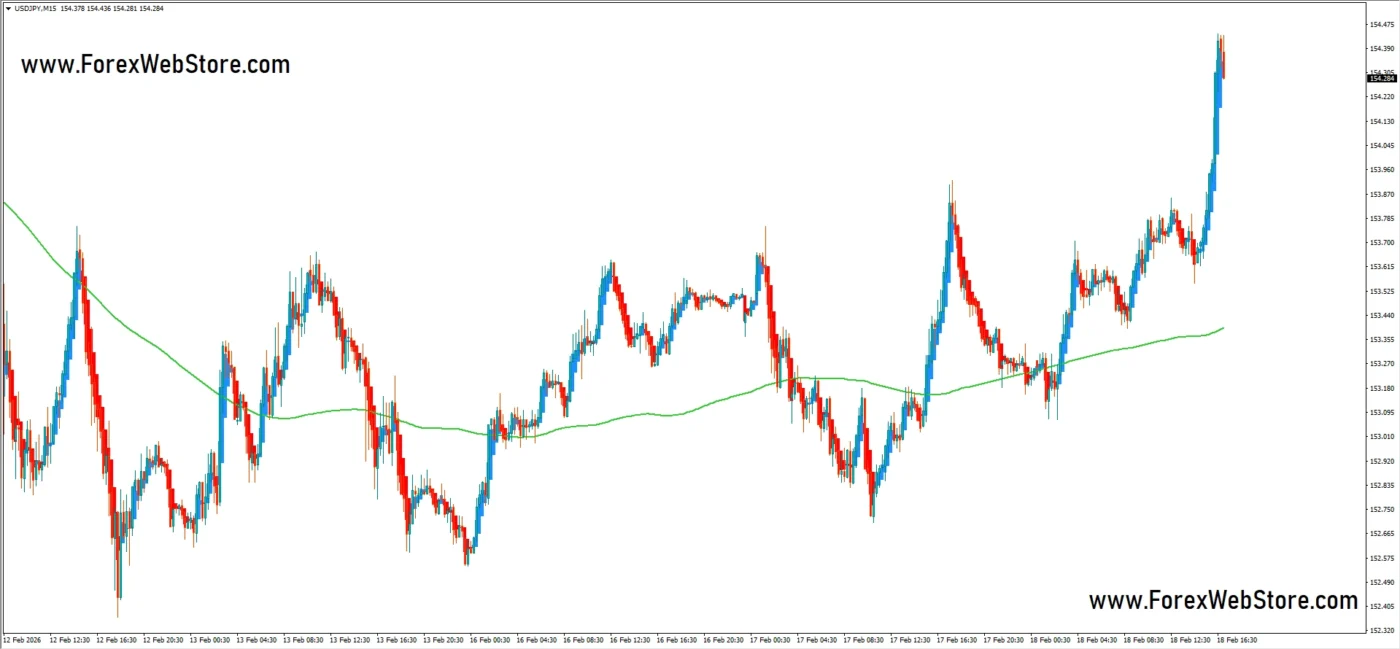
This indicator looks like a Heiken Ashi / Momentum Color Candle Trend System (blue = bullish pressure, red = bearish pressure). There is no extra oscillator, so this is a pure trend-following momentum strategy.
I will explain clearly:
- Entry rules
- Stop loss placement
- Take profit (1:2 RR)
- Risk management
- Professional filtering tips
✅ 1️⃣ Understand the Indicator Logic
- Blue candles = Strong bullish momentum
- Red candles = Strong bearish momentum
- Consecutive same-color candles = Trend continuation
- Small mixed candles = Consolidation (avoid)
This system works best in trending markets.
✅ 2️⃣ Trend Identification (Very Important)
Before entry, identify structure:
🔵 Buy Trend:
- Higher highs and higher lows
- Consecutive blue candles
- Strong bullish breakout
🔴 Sell Trend:
- Lower highs and lower lows
- Consecutive red candles
- Strong bearish breakdown
Avoid trading in sideways zones (small alternating candles).
✅ 3️⃣ Entry Rules
🔵 BUY Entry
Enter buy when:
- A strong bullish candle closes (big blue candle)
- Break of previous swing high
- At least 2–3 consecutive blue candles
👉 Entry = Next candle open
🔴 SELL Entry
Enter sell when:
- Strong bearish candle closes (big red candle)
- Break of previous swing low
- 2–3 consecutive red candles
👉 Entry = Next candle open
✅ 4️⃣ Stop Loss Placement
Never use random SL.
For Buy:
- Below recent swing low
OR - Below last red candle low
For Sell:
- Above recent swing high
OR - Above last blue candle high
Structure-based SL is safest.
✅ 5️⃣ Take Profit – 1:2 Risk Reward Strategy
Always use minimum 1:2 RR.
Example:
Stop Loss = 20 pips
Take Profit = 40 pips
Formula:
For Buy:
TP = Entry + (Risk × 2)
For Sell:
TP = Entry − (Risk × 2)
Even 45–50% win rate becomes profitable with 1:2 RR.
✅ 6️⃣ Trailing Stop Strategy (Advanced)
When price moves equal to your risk (1R):
- Move SL to breakeven
- Trail below last higher low (buy)
- Trail above last lower high (sell)
This captures strong trends like the one visible on the right side of your chart.
✅ 7️⃣ Risk Management Rules
Professional traders focus on risk first.
- Risk 1% per trade (recommended)
- Maximum 2%
Example:
$1000 account
1% risk = $10
If SL = 25 pips
Position size = $10 ÷ 25 = $0.40 per pip equivalent
Never increase lot size after losses.
✅ 8️⃣ Best Time to Trade
Works best:
- London session
- New York session
- Strong trending days
Avoid:
- Low volatility Asian session
- High impact news spikes
- Tight consolidation markets
🔥 Example (USDJPY M15)
Bullish breakout at 153.900
Entry = 153.920
Swing low = 153.800
SL = 12 pips
Risk = 12 pips
TP = 24 pips (1:2 RR)
Target = 154.160
Simple momentum continuation trade.
⚠️ Important Rule
Do NOT:
- Enter on first color change (wait for confirmation)
- Trade inside consolidation
- Ignore higher timeframe trend
This strategy is simple but powerful when used with discipline.