
-
×
 Bitcoin M1 To M5 Buy sell Tradingview
1 × $559.00
Bitcoin M1 To M5 Buy sell Tradingview
1 × $559.00
-82%
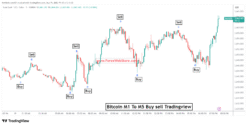
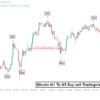
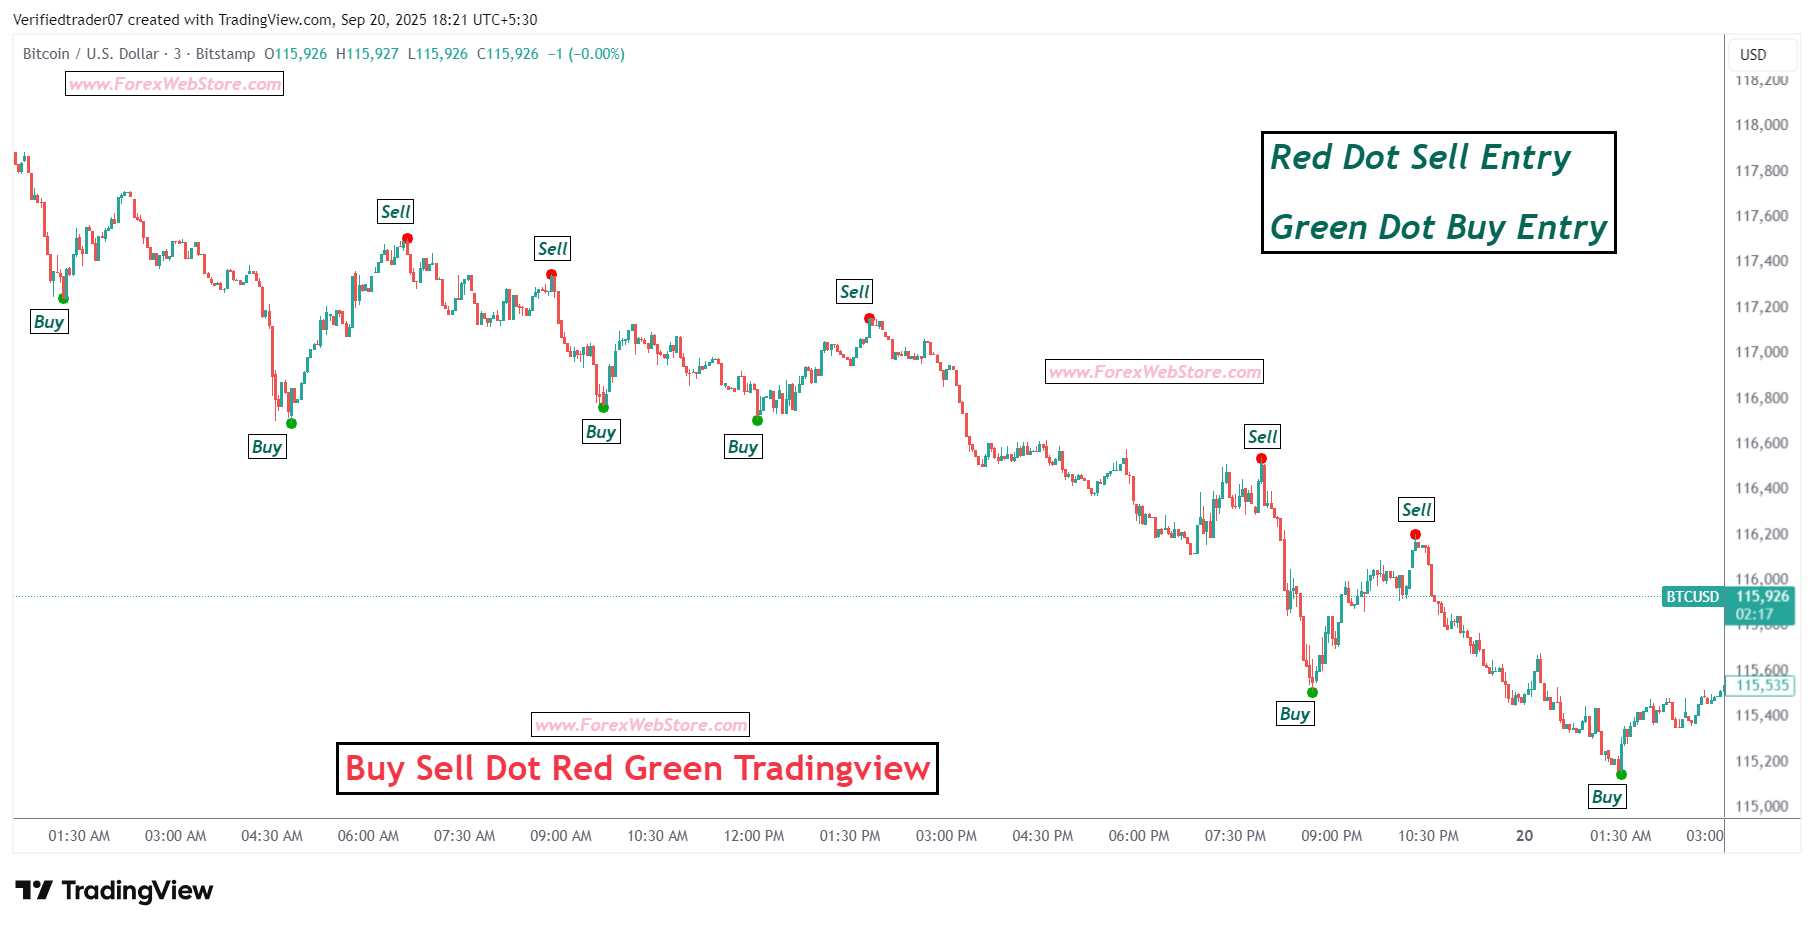
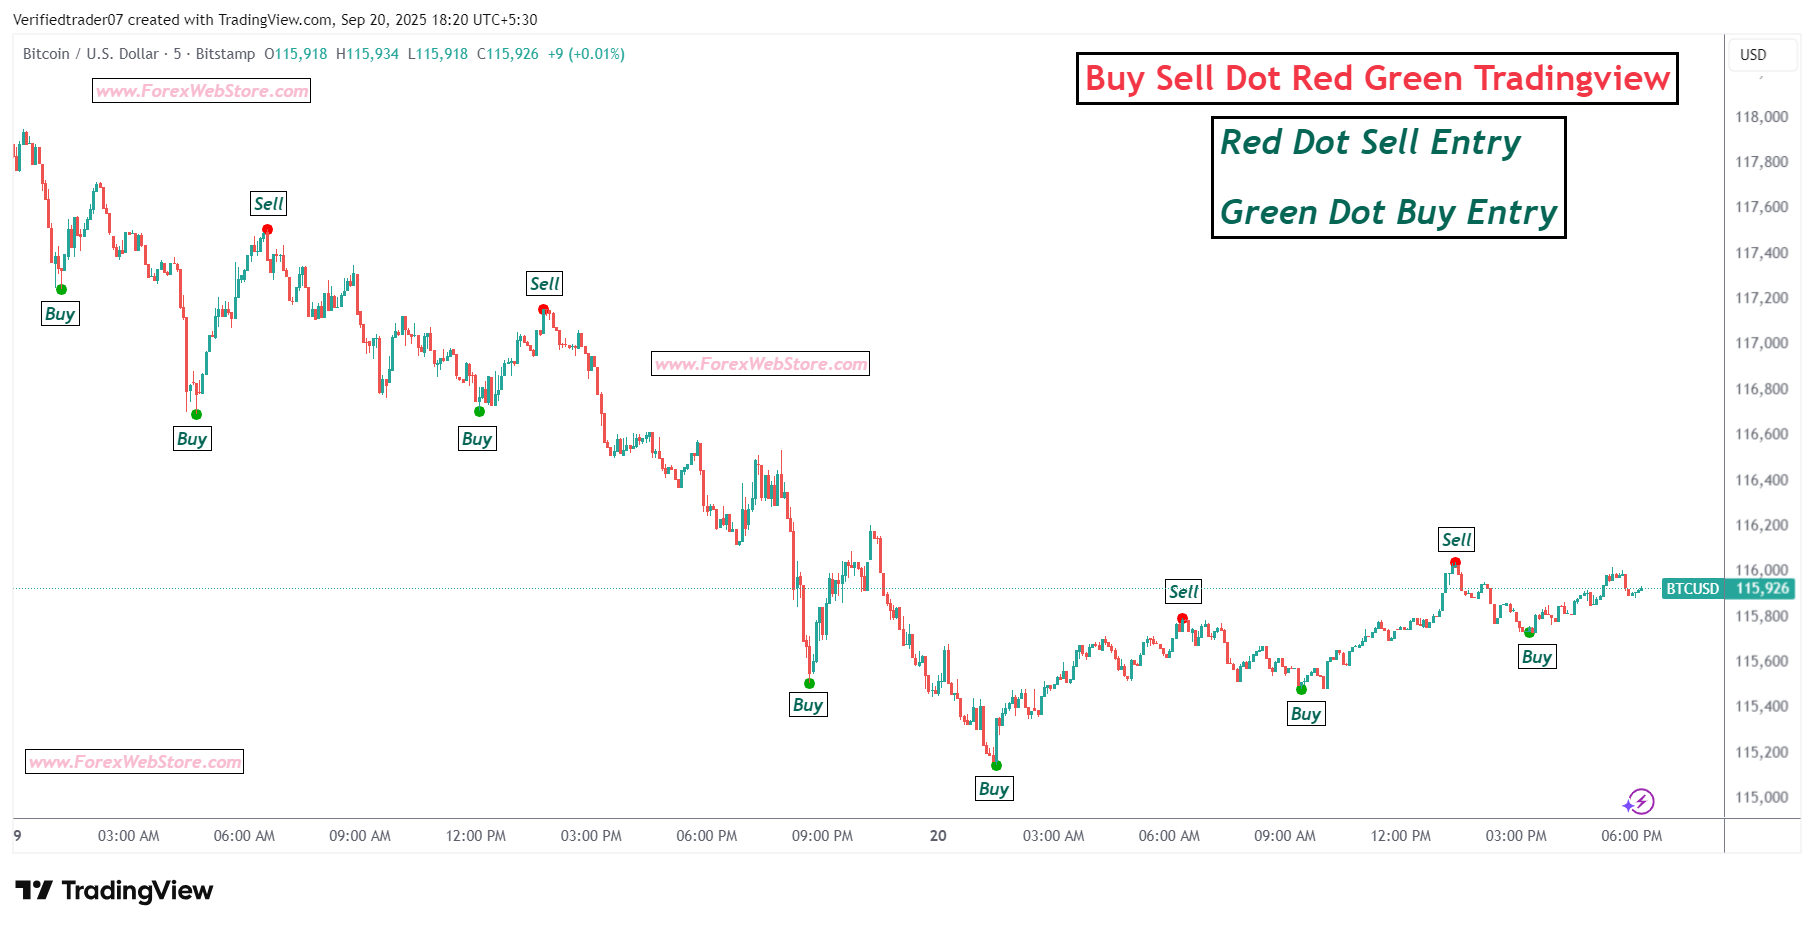
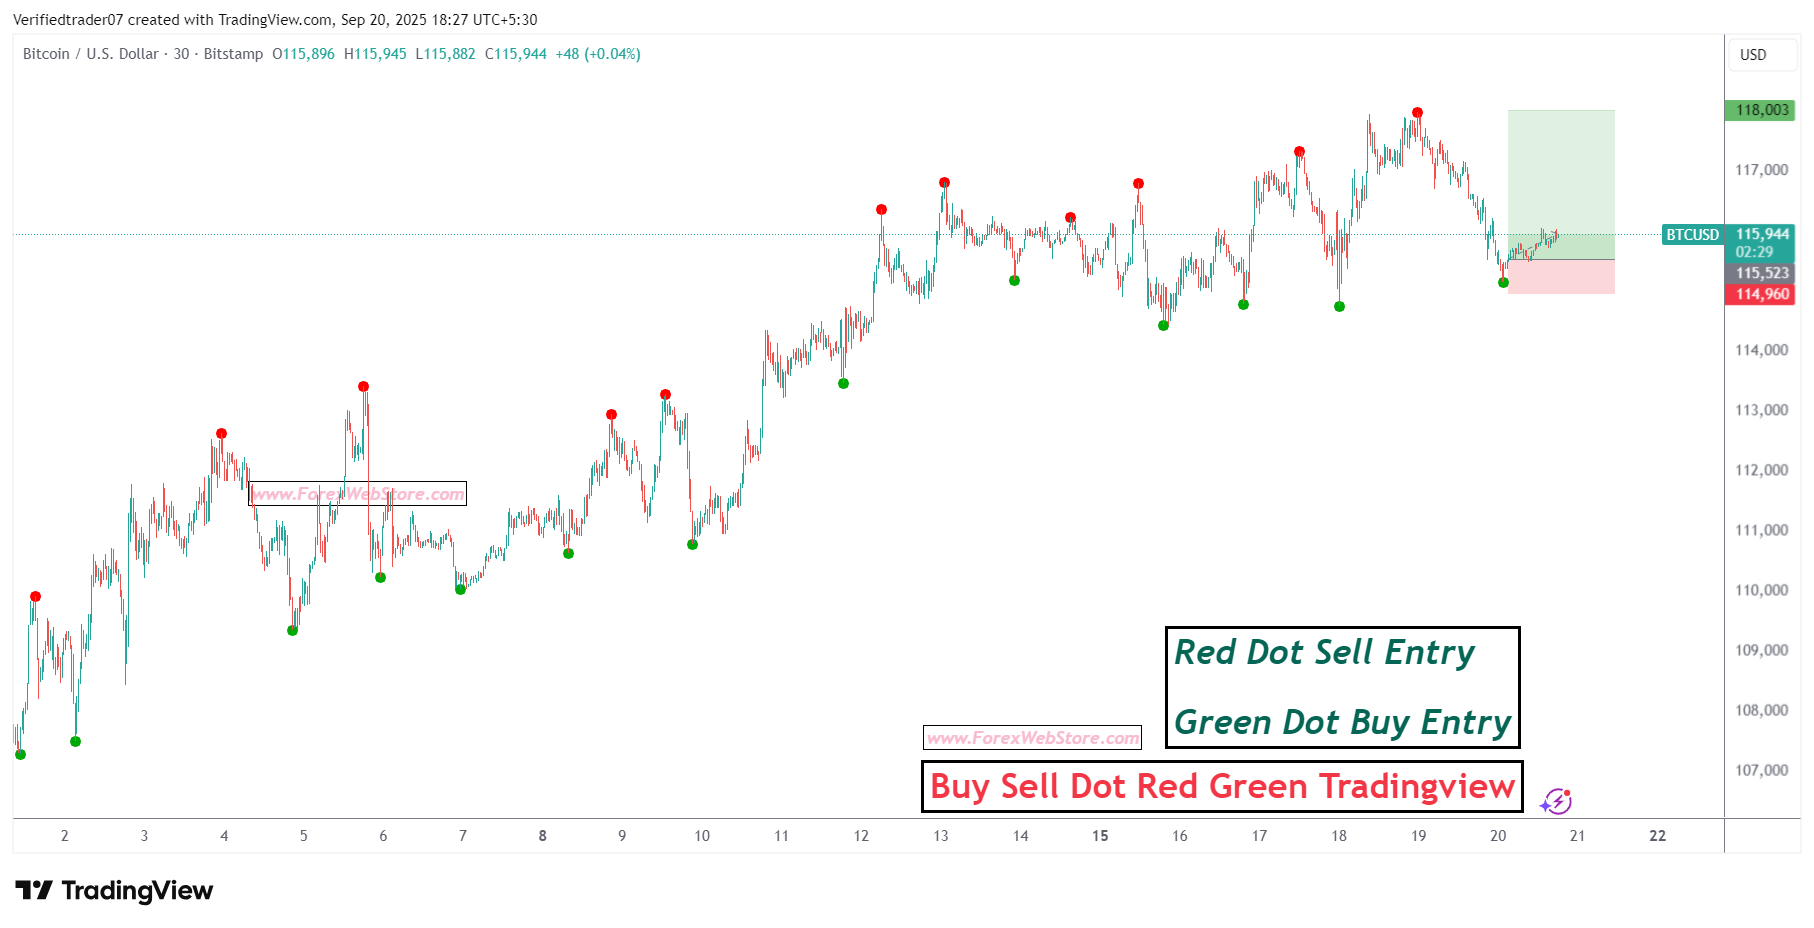
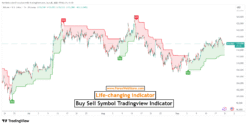
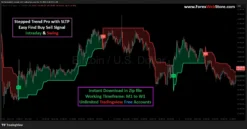
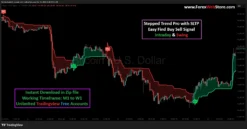
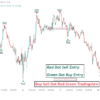
Buy Sell Dot Red Green Tradingview

Original price was: $1,999.00.$350.00Current price is: $350.00.
If you want this indicator then you can pay crypto 279$ (Contact Admin) Click Here
- Original Indicator
- Trading time: Every time
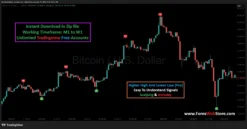
- Instant Download in Zip file
- Working Timeframe: M1 to W1
- Use on Unlimited Tradingview Accounts
- Type of strategy: Scalping and Intraday
- Source Code:- Pine script
- Works on All pairs Forex, Crypto, Stock Marke etc.
- Customer Support & Free Upgrades
- Lifetime Version
A “Buy Sell Dot Red Green” indicator is a type of technical analysis tool found on platforms like TradingView. The name itself is descriptive of its visual function: it places colored dots or arrows on a price chart to signal potential buy and sell opportunities. It’s important to note that there isn’t a single, universally defined indicator with this name. Instead, many different creators on TradingView have developed their own versions using various combinations of underlying indicators and logic.
Therefore, the exact rules for entry, exit, and installation will depend on the specific version of the indicator you are using. However, here is a general guide based on the common principles behind these types of tools.
Installation on TradingView
- Open TradingView: Go to the TradingView website and open a chart for the asset you want to trade (e.g., BTC/USD or XAU/USD).
- Open the Pine Editor: Look for the “Pine Editor” tab at the bottom of your chart. Click on it to open the editor pane.
- Paste the Code: Delete any existing code in the editor and paste the Pine Script code you have.
- Name and Save: Click the “Save” button, give your script a name (e.g., “My Custom Buy/Sell Dots”), and click Save. This saves the script to your personal account on the cloud.
- Add to Chart: After saving, click the “Add to Chart” button. The script will be compiled and applied to your chart immediately.
Common Buy and Sell Rules
The logic for these indicators is typically based on crossovers of moving averages, momentum indicators (like RSI or MACD), or other technical analysis concepts. The green and red dots/arrows are the visual representation of these rules being met.
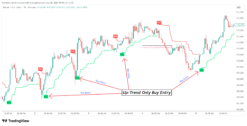
Buy Entry Rules:
- Signal: A common buy signal is a green dot or a green upward-pointing arrow appearing below the price candle.
- Confirmation: The indicator’s underlying logic may require other conditions to be met, such as the price being above a key moving average or a momentum indicator crossing above a certain level. Some strategies also suggest waiting for the candle with the green dot to close before entering the trade.
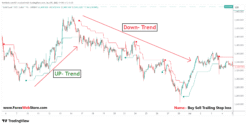
- Trend Confirmation: Traders often use the indicator in conjunction with a higher time frame to confirm the overall trend. For example, a buy signal on the M15 chart is considered stronger if the daily chart shows a clear uptrend.
Sell Entry Rules:
- Signal: A sell signal is typically a red dot or a red downward-pointing arrow appearing above the price candle.
- Confirmation: Similar to the buy rules, a valid sell signal might require the price to be below a key moving average or for a momentum indicator to cross below a certain level.
- Trend Confirmation: A sell signal is often more reliable when the overall trend on a higher time frame is bearish.
Exit Strategy
Relying solely on the opposite signal (a red dot to exit a buy trade) is a common but often risky strategy. Most traders using these indicators combine them with other methods for managing risk and taking profits.
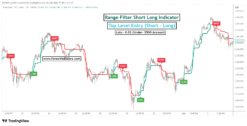
- Fixed Targets: Set a predetermined take-profit target, such as 1:2 or 1:3 risk-to-reward ratio. For example, if your stop-loss is 20 pips, your take-profit would be 40 or 60 pips.
- Stop-Loss: A stop-loss is a crucial component of any trading strategy. A common practice is to place the stop-loss order just below the candle where the buy dot appeared or just above the candle where the sell dot appeared.
- Trailing Stop: This strategy involves moving your stop-loss up (for a buy trade) as the price moves in your favor, locking in profits.
- Support and Resistance: Many traders use the indicator to find an entry and then use key support and resistance levels on the chart as their take-profit or stop-loss points.
Forex indicators are powerful tools for traders, acting as a key part of technical analysis. They are mathematical calculations that analyze historical price data to help traders find trading opportunities
2 reviews for Buy Sell Dot Red Green Tradingview
Add a review
You must be logged in to post a review.
Related products
-84%
Tradingview
Original price was: $1,589.00.$259.00Current price is: $259.00.
-94%
Tradingview
Original price was: $3,999.00.$250.00Current price is: $250.00.
-94%
Tradingview
Original price was: $3,999.00.$250.00Current price is: $250.00.
-90%

Tradingview
Original price was: $1,500.00.$145.00Current price is: $145.00.
-77%
Tradingview
Original price was: $1,500.00.$350.00Current price is: $350.00.
-87%
Tradingview
Original price was: $3,999.00.$526.00Current price is: $526.00.
-85%


Tradingview
Original price was: $1,999.00.$299.00Current price is: $299.00.
-87%
Tradingview
Original price was: $1,500.00.$199.00Current price is: $199.00.
Gates –
Awesome Service, and fantastic indicators, I’m trading for last 25 years and those indicators are very helpful to confirm the trend. Nice Job Forexwebstore
Ryan Dana –
Great Service! Helped me with what I needed and adapted to my request.