
-
×
 Higher High And Lower Low [Pro]
1 × $226.00
Higher High And Lower Low [Pro]
1 × $226.00 -
×
 Buy Sell Symbol Tradingview Indicator
1 × $140.00
Buy Sell Symbol Tradingview Indicator
1 × $140.00 -
×
 Buy Sell Dot Red Green Tradingview
1 × $150.00
Buy Sell Dot Red Green Tradingview
1 × $150.00 -
×
 Forex Holy Grail Indicator V4
1 × $399.00
Forex Holy Grail Indicator V4
1 × $399.00 -
×
 Professional Buy Sell Trend Signal [High Contrast]
1 × $145.00
Professional Buy Sell Trend Signal [High Contrast]
1 × $145.00 -
×
 Forex Point Grail Indicator
1 × $279.00
Forex Point Grail Indicator
1 × $279.00 -
×
 Forex Arrow Grail Indicator
1 × $229.00
Forex Arrow Grail Indicator
1 × $229.00 -
×
 Buy Sell ICT Tradingview Indicator
1 × $199.00
Buy Sell ICT Tradingview Indicator
1 × $199.00 -
×
 Forex Buy Sell Grail Indicator
1 × $299.00
Forex Buy Sell Grail Indicator
1 × $299.00 -
×
 Higher High And Lower Low Tradingview
1 × $250.00
Higher High And Lower Low Tradingview
1 × $250.00 -
×
 Super Trend Arrows Pro
1 × $159.00
Super Trend Arrows Pro
1 × $159.00
-85%
Replicated SMC Structure & PD Zones
Original price was: $3,999.00.$589.00Current price is: $589.00.
If you want this indicator then you can pay crypto 399$ (Contact Admin) Click Here
- Original Indicator
- Trading time: Every time
- Instant Download in Zip file
- Working Timeframe: M1 to W1
- Use on Unlimited Tradingview Accounts
- Type of strategy: Scalping and Intraday
- Source Code:- Pine script
- Works on All pairs Forex, Crypto, Stock Marke etc.
- Customer Support & Free Upgrades
- Lifetime Version
 BUY NOW & GET DIGITAL File
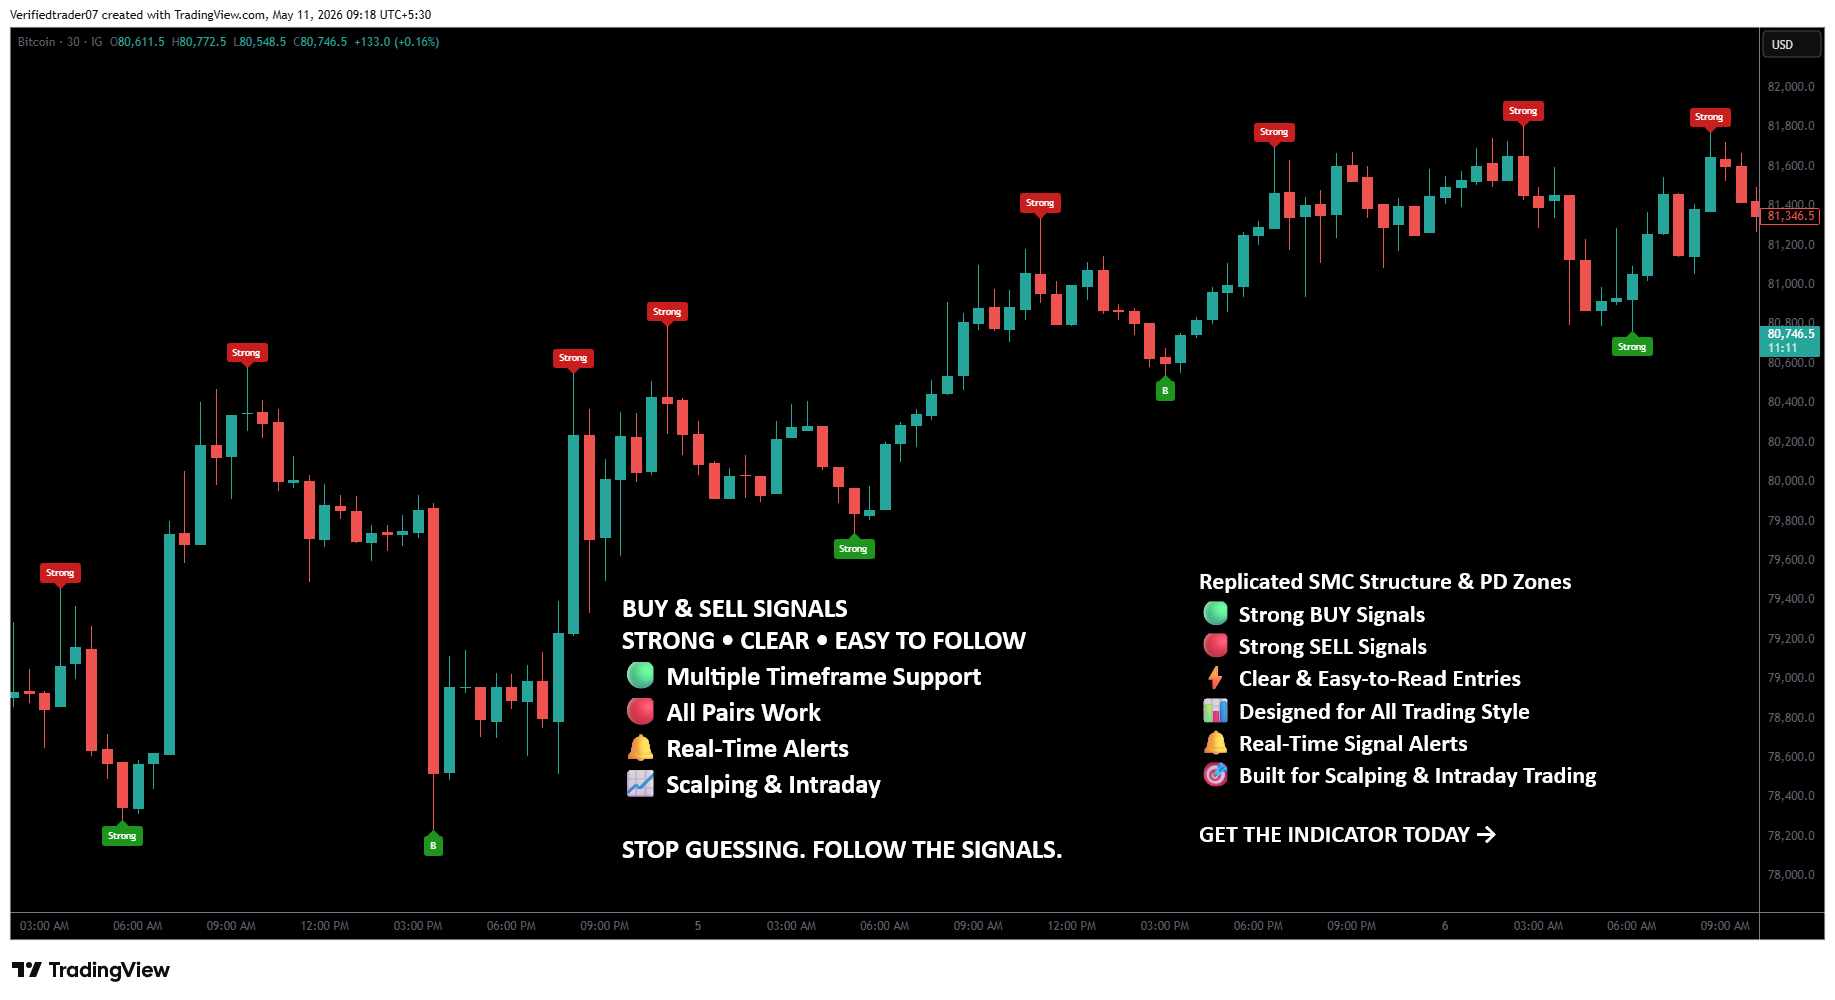
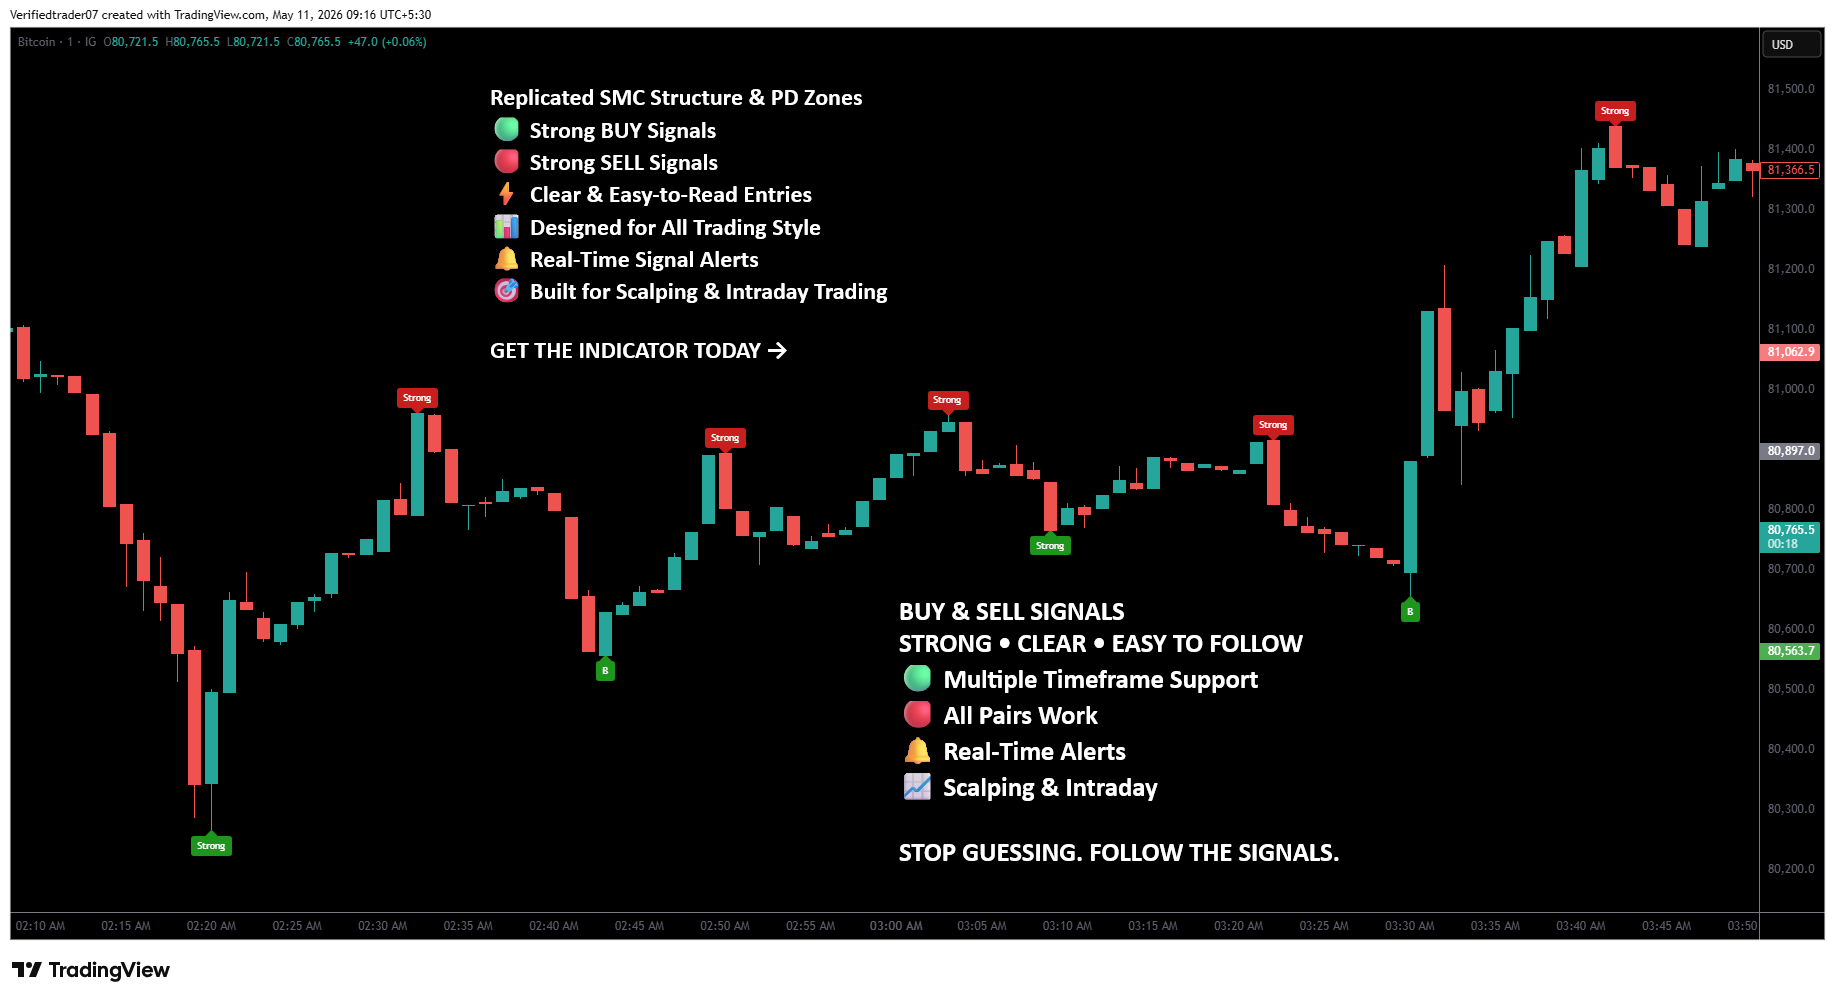
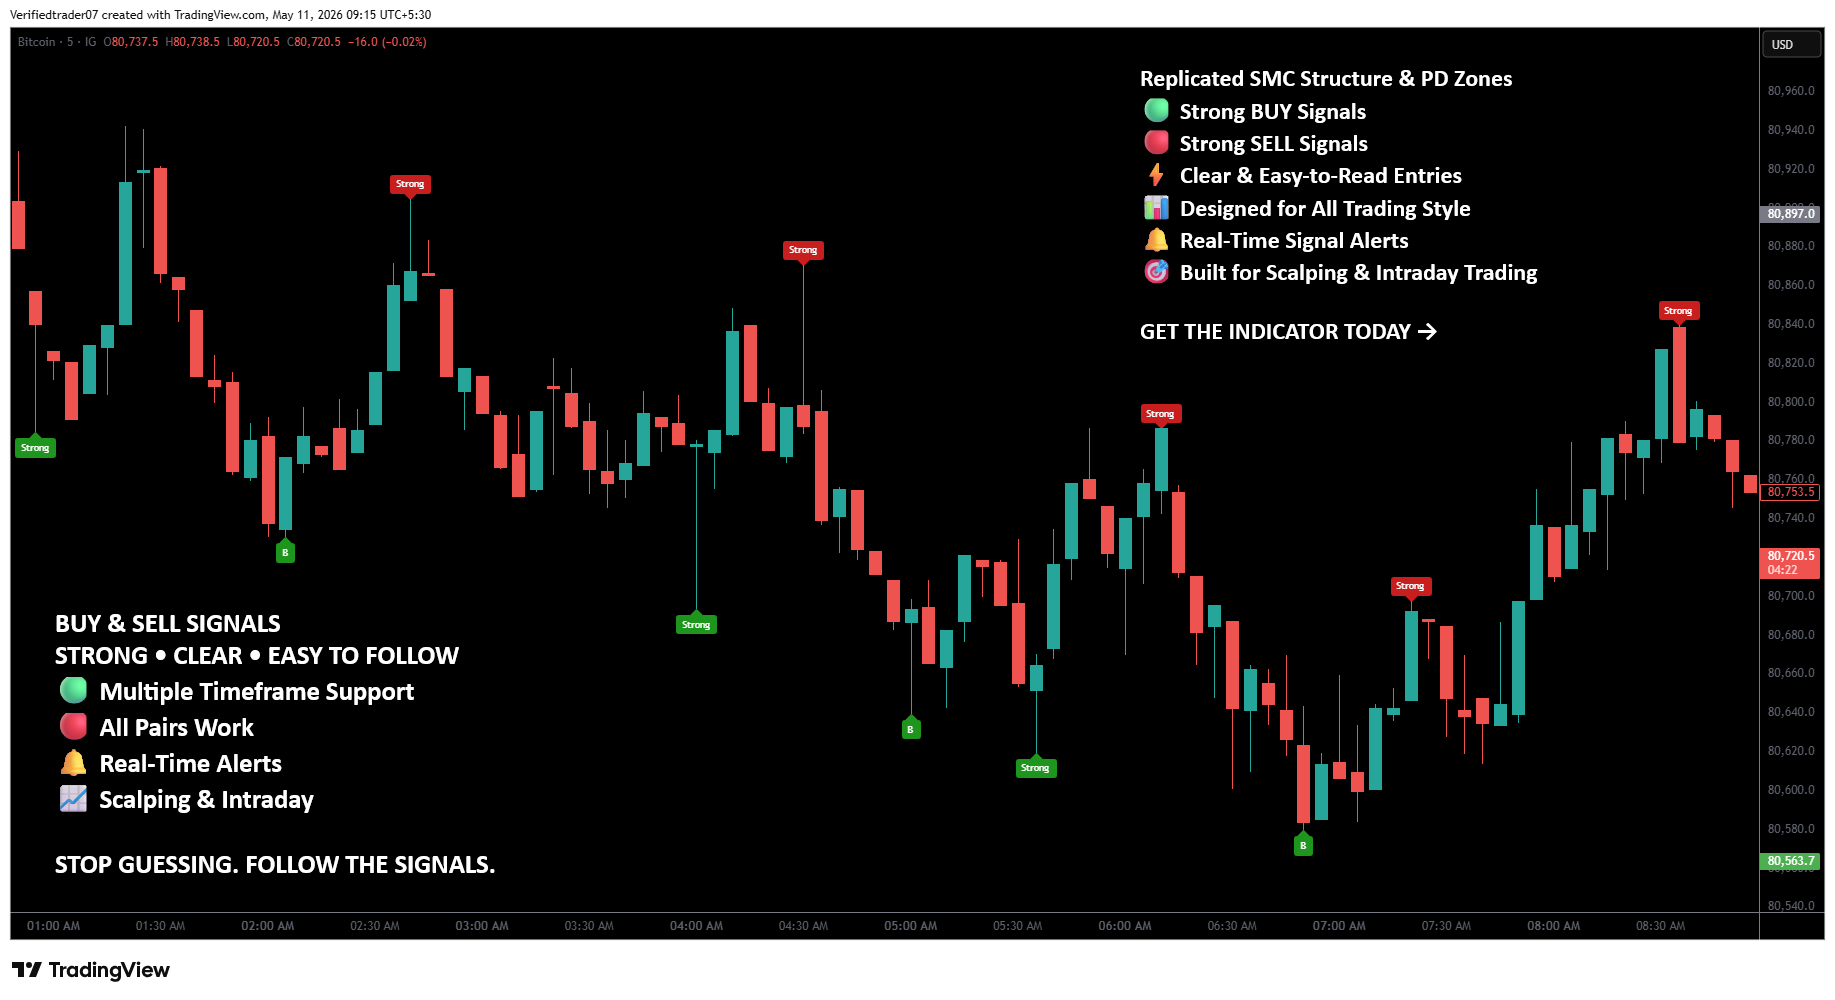
The Replicated SMC Structure & PD Zones Indicator shown in your TradingView screenshot is a market-analysis indicator designed to help traders identify potential BUY and SELL opportunities, market structure, premium/discount areas, and short-term trading setups.
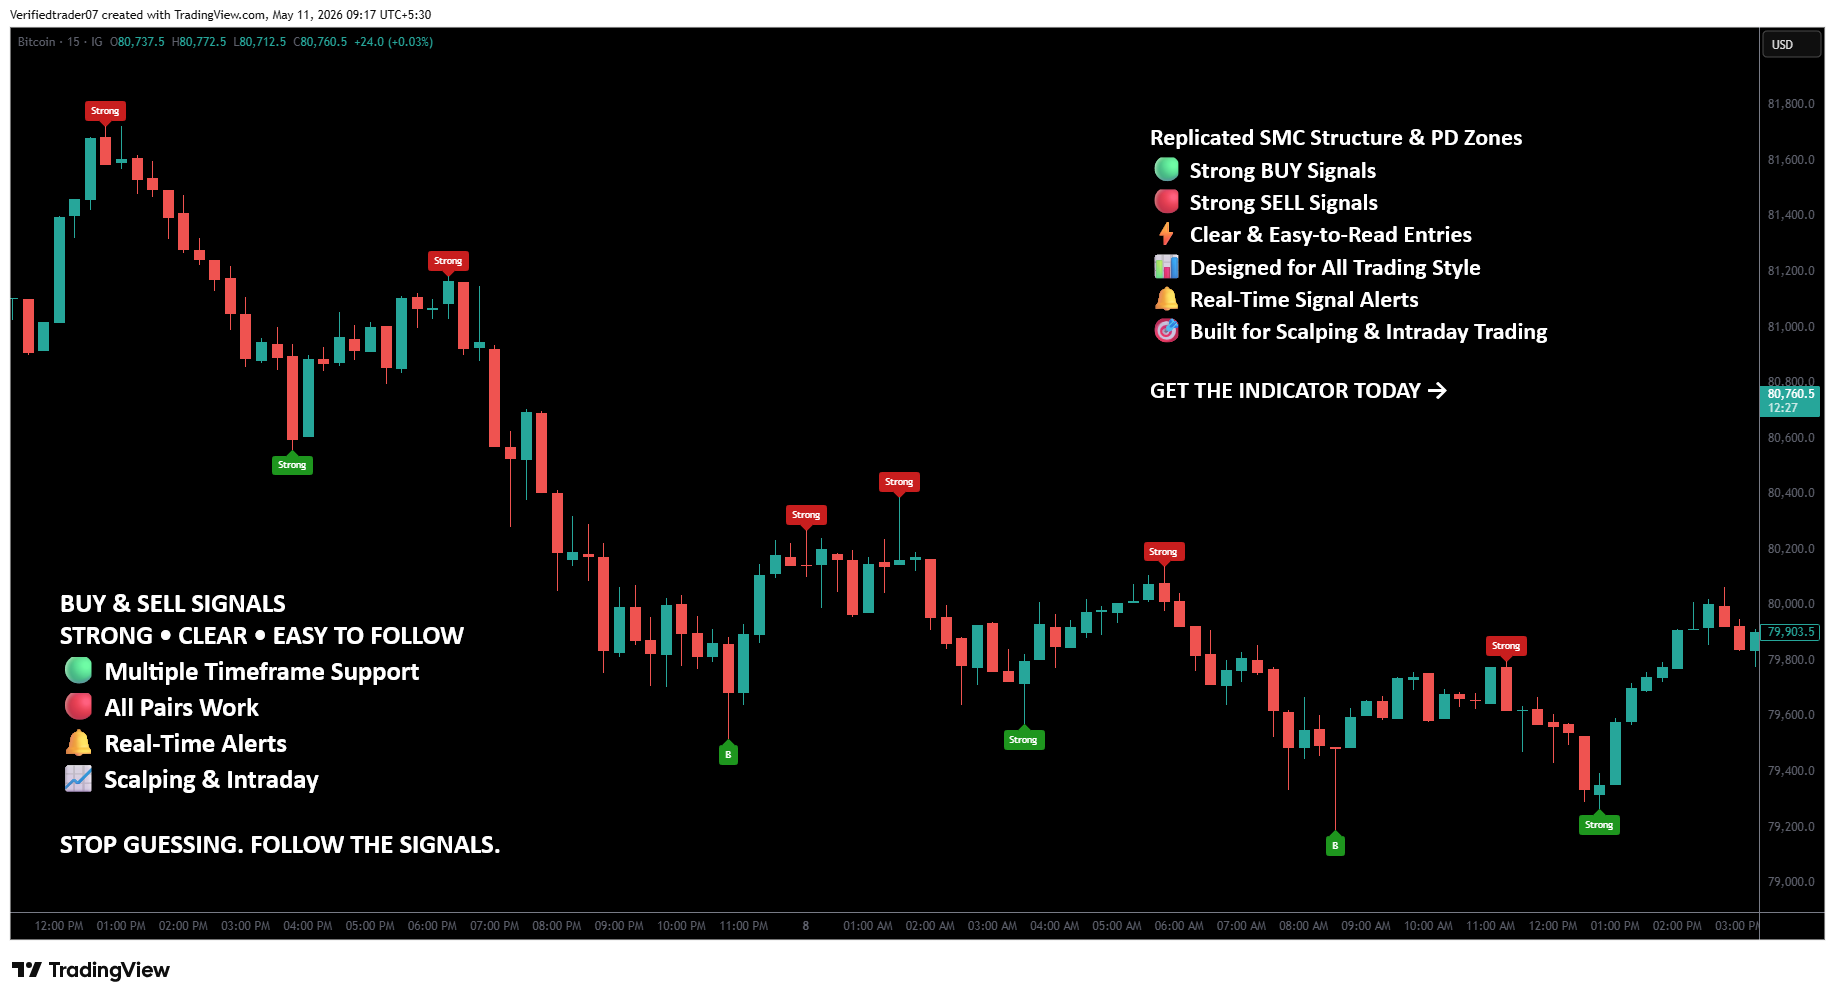
The screenshot shows the indicator being used on a Bitcoin (BTC) 5-minute chart. It displays clearly marked BUY and SELL signals along with “Strong” labels and is positioned as a tool for scalping and intraday trading.
The indicator’s main selling points shown in the chart are:
- Replicated SMC Structure & PD Zones
- Strong BUY Signals
- Strong SELL Signals
- Clear & Easy-to-Read Entries
- Designed for All Trading Style
- Real-Time Signal Alerts
- Built for Scalping & Intraday Trading
- Multiple Timeframe Support
- All Pairs Work
- Real-Time Alerts
What Is the Replicated SMC Structure & PD Zones Indicator?
This indicator combines concepts associated with Smart Money Concepts (SMC) and Premium/Discount (PD) zones with visual BUY and SELL signals.
The objective is to simplify market-structure analysis.
Traditional SMC analysis can involve studying:
- Market structure
- Swing highs and lows
- Break of Structure (BOS)
- Change of Character (CHoCH)
- Liquidity
- Supply and demand
- Premium zones
- Discount zones
- Order blocks
- Fair Value Gaps
- Price displacement
For beginners, analyzing all of these concepts manually can be complicated.
An indicator such as this attempts to turn some of that information into easy-to-read chart signals.
Strong BUY Signals
One of the primary features shown in the screenshot is:
Strong BUY Signals
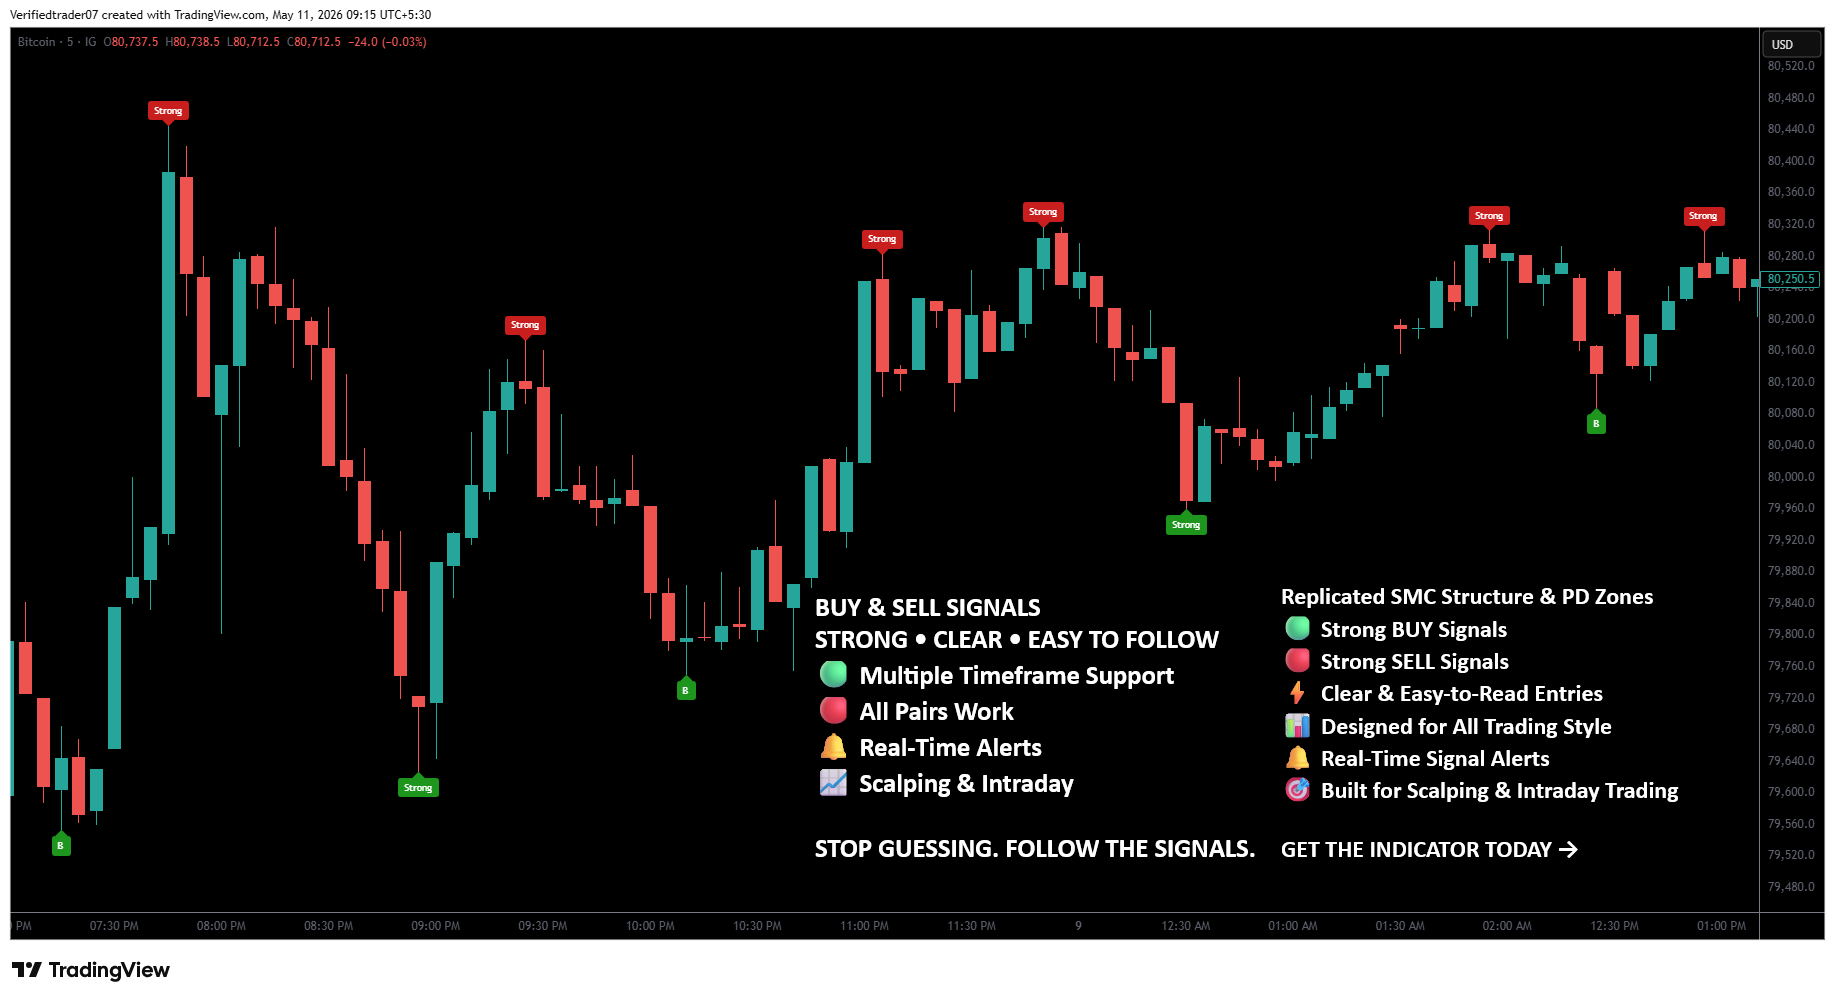
BUY signals appear as green markers underneath price.
For example, the chart shows green “B” markers and green “Strong” labels.
These signals are intended to highlight areas where the indicator detects conditions that may favor upward price movement.
A basic interpretation is:
Green BUY signal → potential bullish trading opportunity
However, a BUY signal should not automatically be treated as a guaranteed instruction to enter a trade.
Strong SELL Signals
The indicator also displays red “Strong” labels above the candles.
These represent potential SELL opportunities.
The basic interpretation is:
Red SELL signal → potential bearish trading opportunity
For example, if Bitcoin moves upward into a potential premium area and the indicator produces a strong SELL signal, the trader can investigate whether the market is beginning to reject higher prices.
Smart Money Concepts (SMC)
The indicator is described as using:
“Replicated SMC Structure & PD Zones.”
SMC, or Smart Money Concepts, is a popular trading-analysis framework focused on price structure and the behavior of liquidity.
Some important SMC concepts include:
Market Structure
Understanding whether price is creating:
- Higher Highs
- Higher Lows
- Lower Highs
- Lower Lows
Break of Structure
A significant break beyond a previous swing point can suggest that the current market structure is changing or continuing.
Change of Character
A change in price behavior can indicate that the previous trend may be weakening.
Liquidity
Markets often move toward areas where orders and liquidity are concentrated.
Premium and Discount
Price can be divided into areas where traders consider the current price relatively expensive or relatively cheap within a defined range.
Premium and Discount Zones
The PD in the indicator name refers to:
Premium / Discount.
The basic idea is to divide a selected price range into two important areas.
Discount Area
The lower portion of a range is considered the discount area.
Traders looking for BUY setups may prefer to see price move into a discount area before looking for bullish confirmation.
Premium Area
The upper portion of a range is considered the premium area.
Traders looking for SELL setups may prefer to see price move into a premium area before looking for bearish confirmation.
The concept can be simplified as:
Discount → Look for BUY opportunities
Premium → Look for SELL opportunities
Real-Time Signal Alerts
Another feature displayed in the screenshot is:
“Real-Time Signal Alerts.”
TradingView allows indicators to be used with alerts when the underlying script supports appropriate alert conditions.
Alerts can help traders monitor the market without constantly watching the chart.
For example, a trader may configure an alert when a particular BUY or SELL condition occurs.
This can be useful because Bitcoin trades continuously, and watching a chart all day is impractical.
However, alerts should still be treated as notifications.
An alert does not automatically mean:
“Enter immediately.”
The trader should still check the chart and apply the trading plan.
Be the first to review “Replicated SMC Structure & PD Zones”
Related products
-96%
Tradingview
Original price was: $3,999.00.$140.00Current price is: $140.00.
-99%
Tradingview
Original price was: $20,000.00.$180.00Current price is: $180.00.
-92%
Tradingview
Original price was: $1,999.00.$150.00Current price is: $150.00.
-97%
Tradingview
Original price was: $3,999.00.$136.00Current price is: $136.00.
-89%
-94%
-81%
MT4 Indicator
Original price was: $1,199.00.$229.00Current price is: $229.00.
-67%

MT4 Indicator
Original price was: $1,199.00.$399.00Current price is: $399.00.
Reviews
There are no reviews yet.