
 Super Channel Arrow Indicator | 100% Non Repaint Indicator V4.0
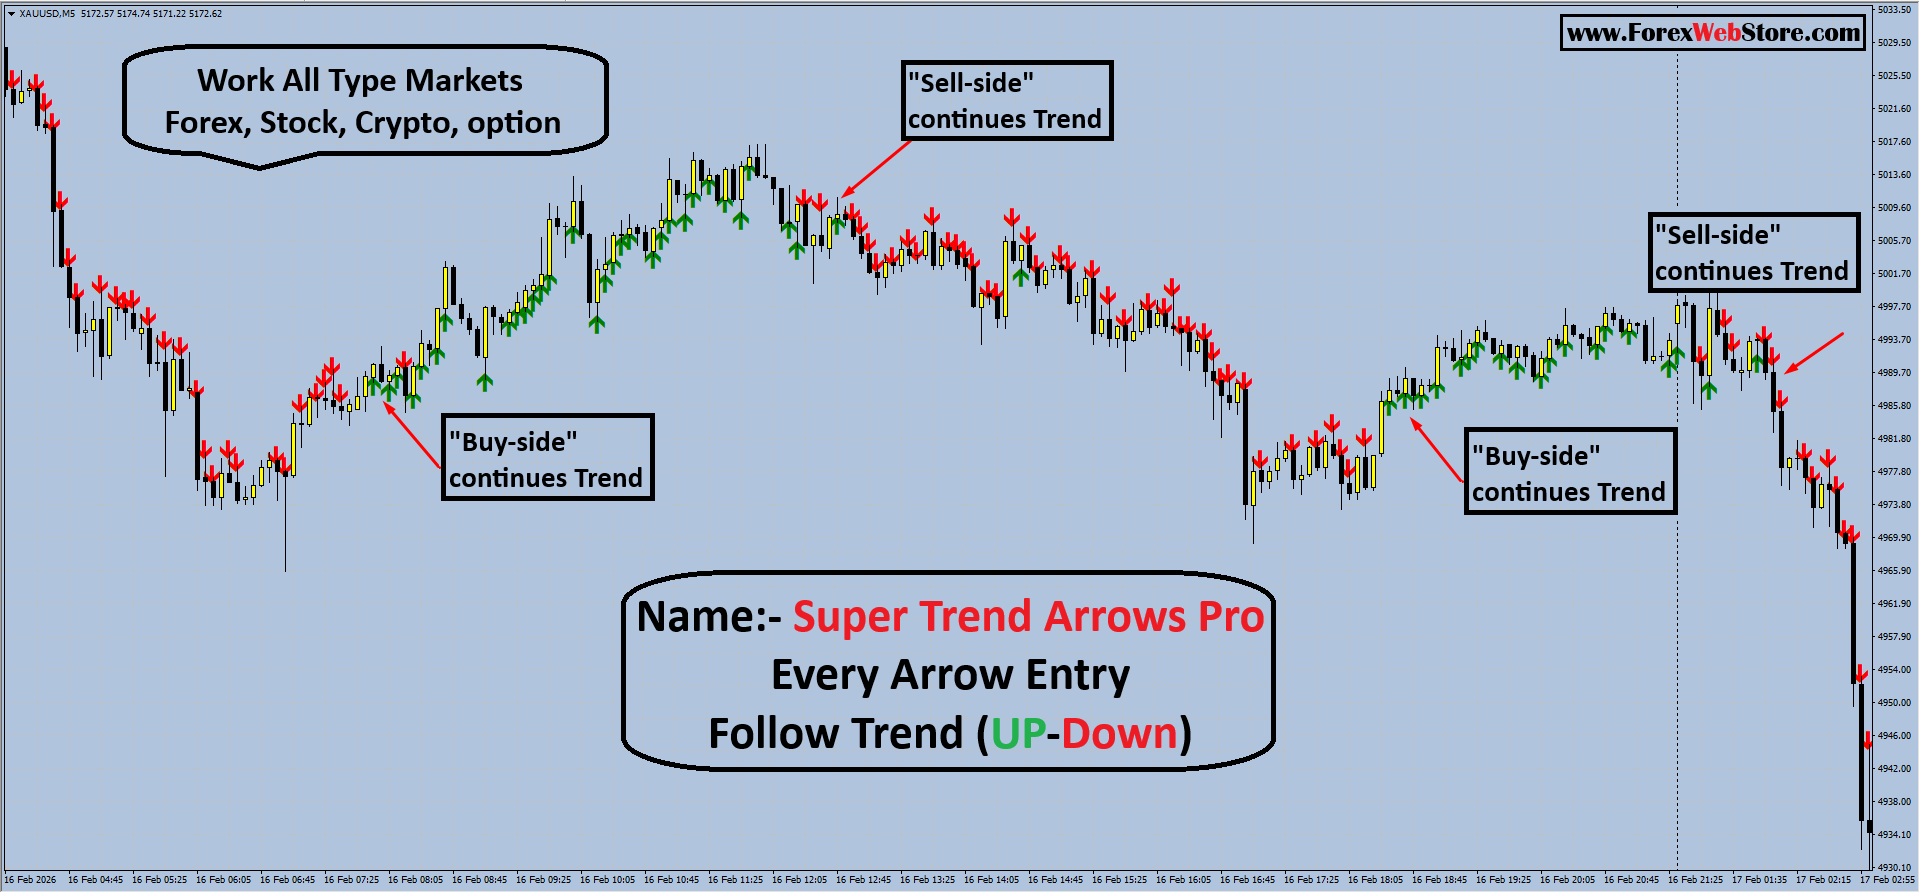
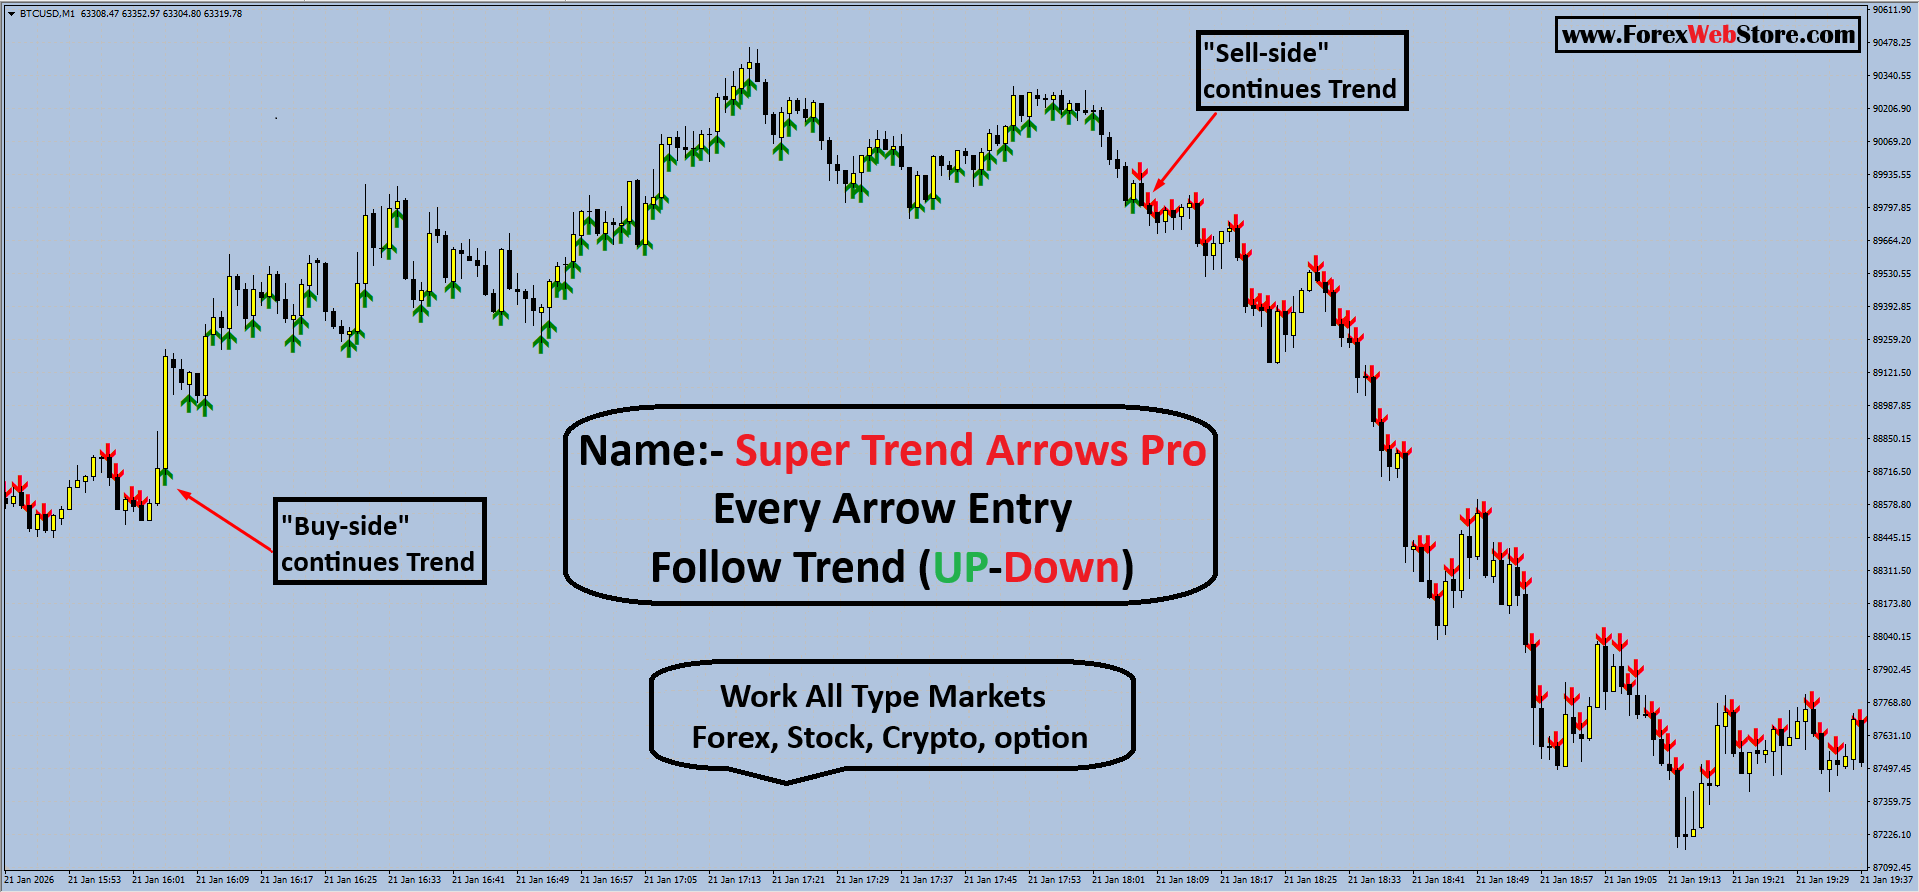
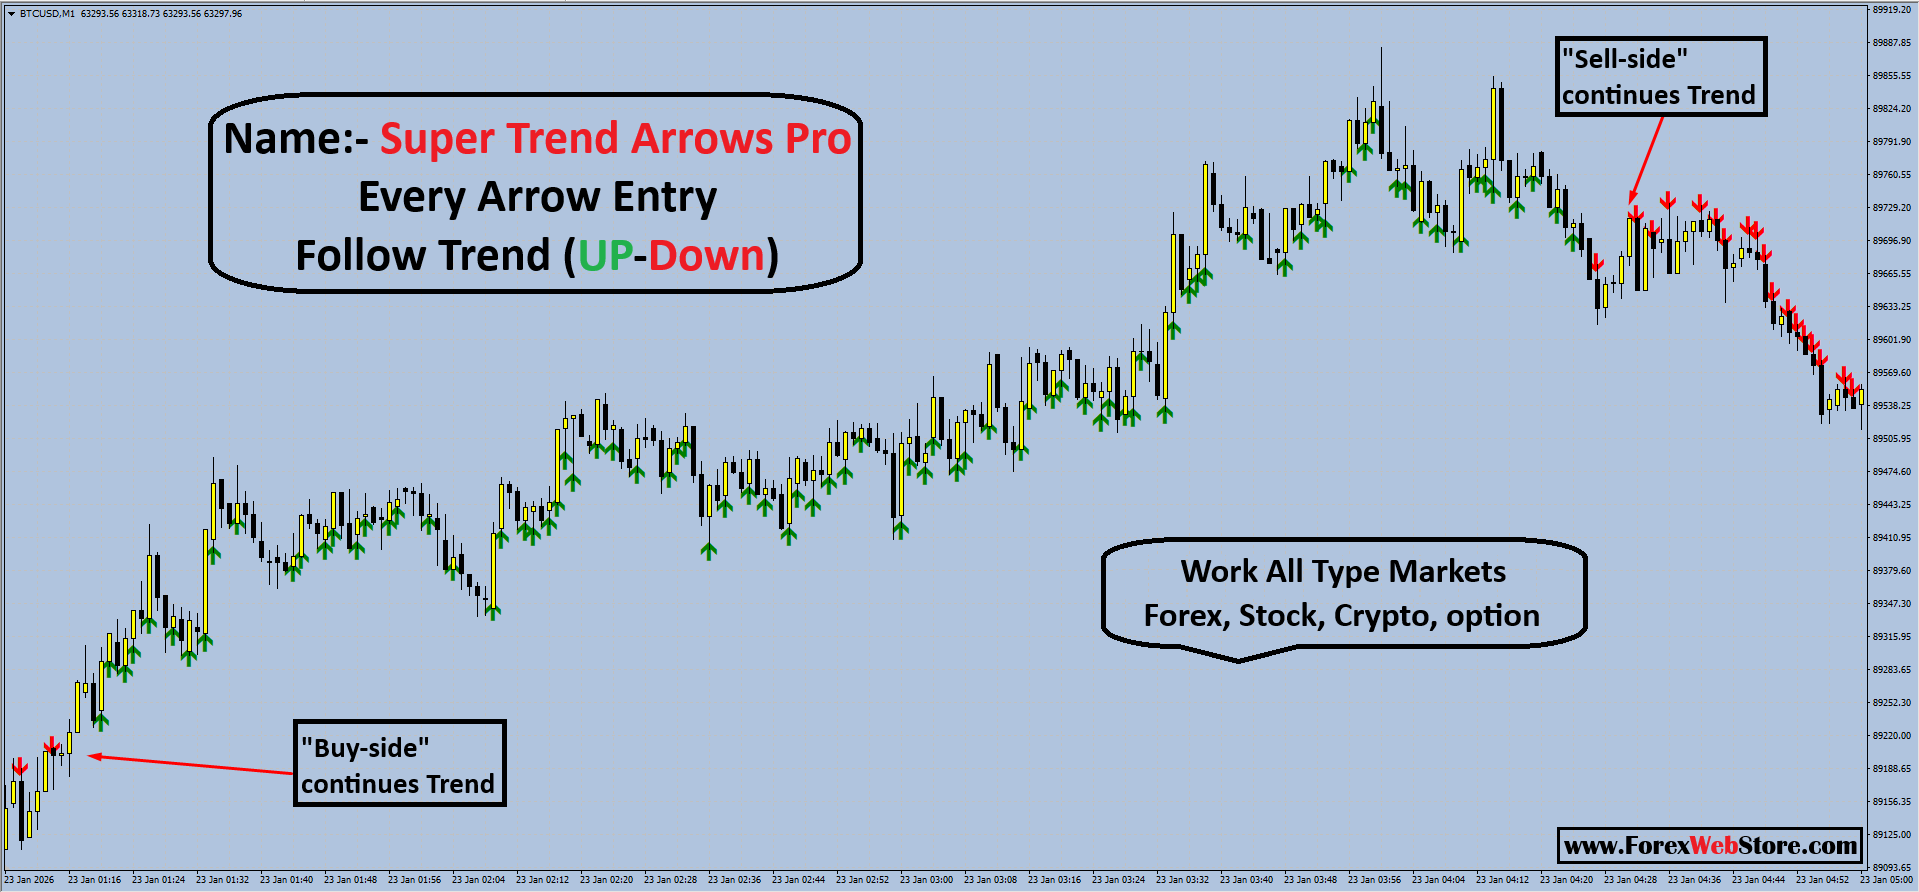
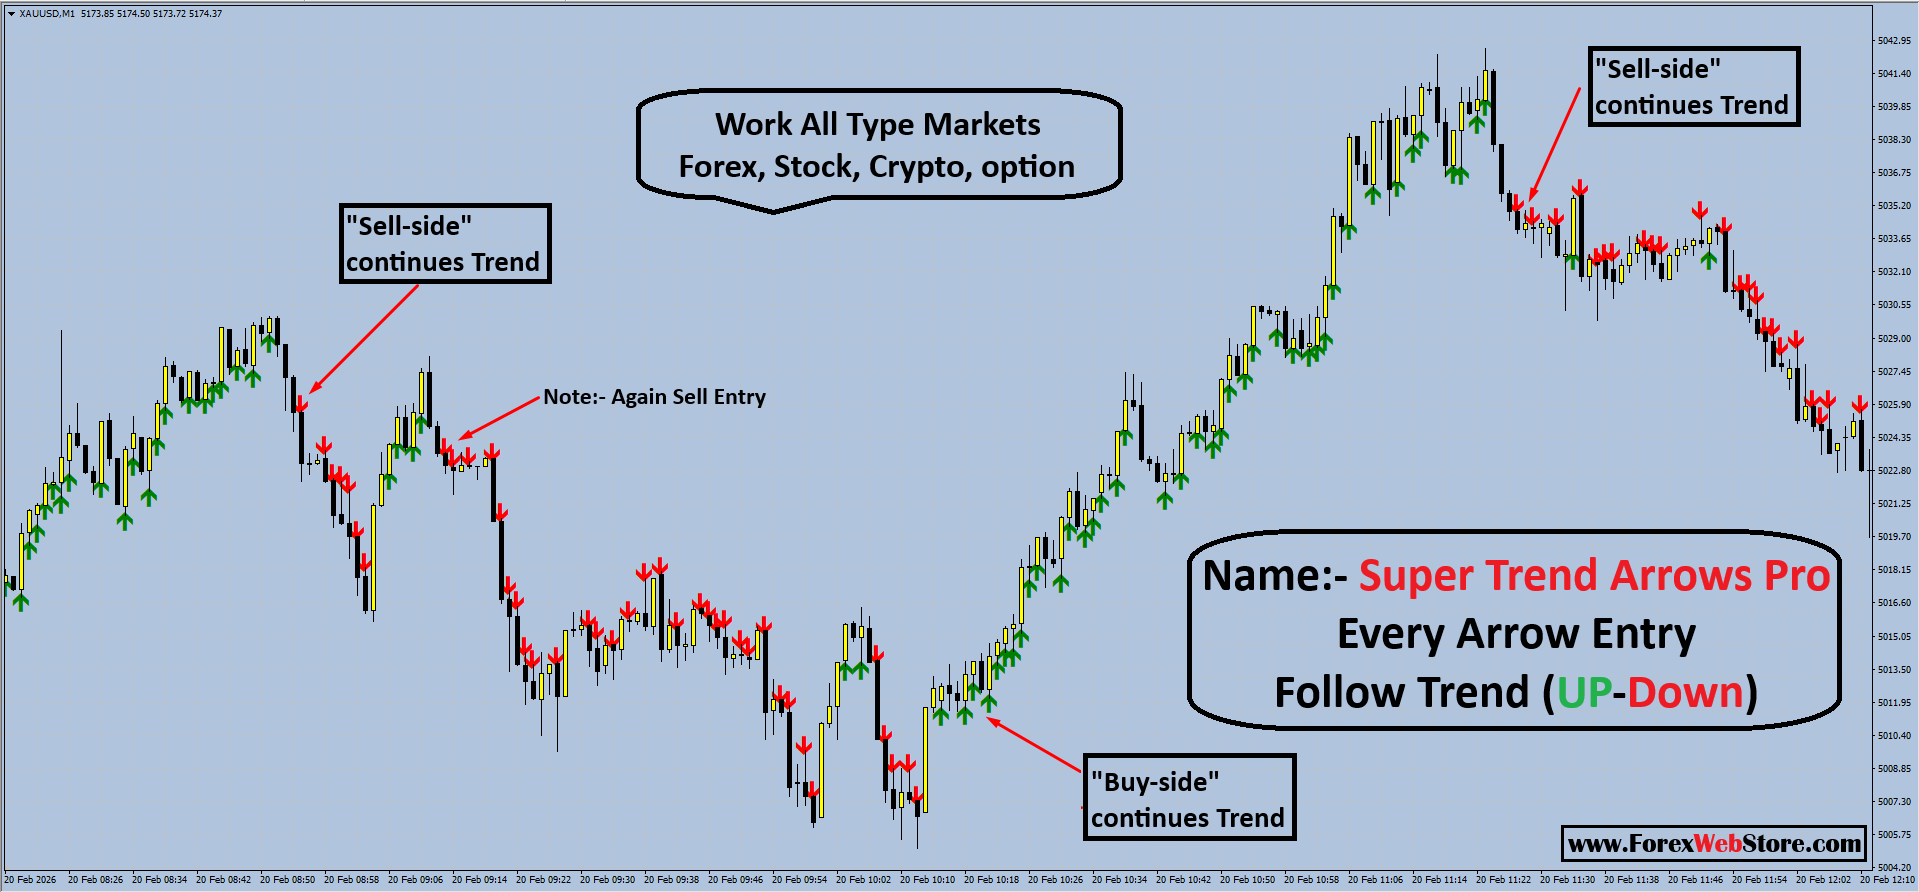
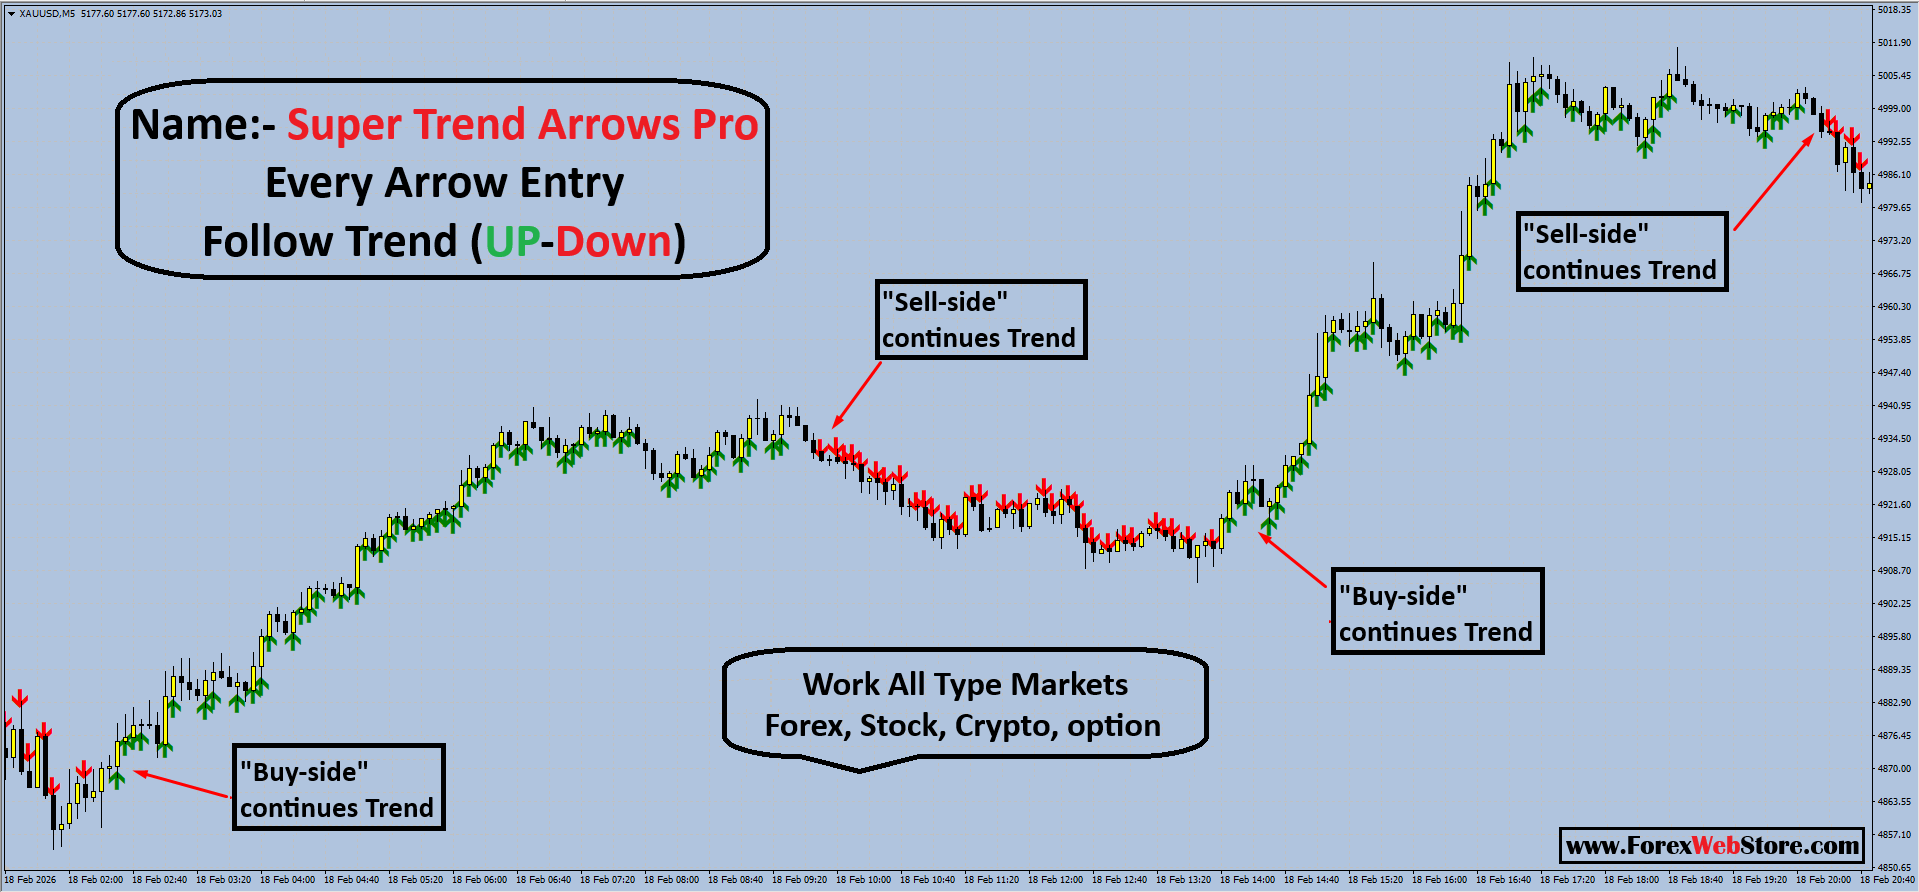
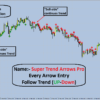
Super Trend Arrows Pro
Original price was: $1,500.00.$199.00Current price is: $199.00.
- Original Indicator
- 100% Non-Repaint
- Trading time: Every time
- Instant Download in Zip file
- Timeframe: M5 and M15
- Never repaint any trading signal, 100% guaranteed
- Use on unlimited MT4 accounts
- Type of strategy: M5 Scalping Indicator
- Built for Metatrader 4 (MT4 for PC and Laptop, MT4 for MAC)
- Works on Forex (all pairs), Commodities, Stocks, Metals, Gold…
- Recommended Broker
- Pay Once and Use for Lifetime
- Customer Support & Free Upgrades For Life Time
- Source Code Available Contcat Email
1. Trade Execution Strategy
The indicator provides visual signals to enter trades based on trend continuation.
-
Buy Entry (Long): Enter when a Green Up-Arrow appears. This indicates a “Buy-side” trend continuation.
-
Sell Entry (Short): Enter when a Red Down-Arrow appears. This indicates a “Sell-side” trend continuation.
-
Best Practice: The most reliable trades often occur at the beginning of a fresh trend (the first arrow) rather than after many consecutive arrows where the move might be exhausted.
2. Stop Loss (SL) and Take Profit (TP)
Proper exit points protect your capital and lock in gains.
-
Stop Loss (SL): * For Buys: Place the SL slightly below the most recent swing low or the low of the candle that generated the green arrow.
-
For Sells: Place the SL slightly above the most recent swing high or the high of the candle that generated the red arrow.
-
-
Take Profit (TP): * Aim for a Risk-to-Reward (RR) ratio of at least 1:1.5 or 1:2.
-
Alternatively, exit the trade when an arrow of the opposite color appears.
-
| Feature | Placement Strategy |
| Stop Loss (SL) | Place your SL a few pips below the most recent Swing Low (for Buys) or above the most recent Swing High (for Sells). Alternatively, place it just behind the signal arrow candle. |
| Take Profit (TP) | Use a fixed Risk-to-Reward ratio of 1:1.5 or 1:2. For example, if your SL is 20 pips, your TP should be 40 pips. |
| Trailing Stop | As the price moves in your favor, move your SL to “Break Even” to protect your capital. |
Don’t just set a random target; use the market’s structure.
-
Stop Loss (SL): Place your SL 3–5 pips behind the most recent swing high/low. This ensures that if the trend actually breaks, you are taken out of the trade before a major reversal.
-
Take Profit 1 (TP1): Set at a 1:1 Risk/Reward. Once hit, move your Stop Loss to the entry price (Break Even).
-
Take Profit 2 (TP2): Set at 1:2 Risk/Reward or wait for an opposite color arrow to appear to close the full position.
3. Risk Management & Lot Sizing
Trading involves high risk; never trade money you cannot afford to lose.
-
The 1% Rule: Never risk more than 1% to 2% of your total account balance on a single trade. If you have a $1,000 account, you should only lose $10 if your Stop Loss is hit.
-
Calculating Lot Size: Your lot size should be based on your Stop Loss distance.
-
Tight SL: You can use a slightly larger lot size.
-
Wide SL: You must use a smaller lot size (like 0.01) to keep the dollar risk the same.
-
- Example: On a $1,000 account, a 1% risk is $10. If your SL is 20 pips away, your lot size would be approximately 0.05 on a standard EURUSD pair.
| Account Balance | Risk per Trade (2%) | Stop Loss (Pips) | Recommended Lot Size |
| $1,000 | $20 | 10 Pips | 0.20 Lots |
| $1,000 | $20 | 20 Pips | 0.10 Lots |
| $1,000 | $20 | 40 Pips | 0.05 Lots |
4. Important Considerations
-
Timeframes: The image shows an M5 (5-minute) chart. While it works for scalping, signals are generally more reliable on higher timeframes like H1 or H4.
-
Confluence: Do not rely solely on arrows. Check if the price is near major Support or Resistance levels before entering.
-
Higher Timeframe Filter: If you are trading on a 5-minute chart (M5), only take Buy signals if the 1-hour chart (H1) is also in an uptrend. Trading with the “Big Trend” significantly increases your win rate.
-
Avoid News: Do not trade 15 minutes before or after major economic news (like NFP or CPI), as high volatility can trigger your Stop Loss before the trend continues.
-
The “First Arrow” Rule: Usually, the first arrow after a trend change is the most profitable. Consecutive arrows (as seen in the image) are “continuation” signals, which carry slightly more risk as the move may be overextended.
Be the first to review “Super Trend Arrows Pro”
You must be logged in to post a review.
Related products


MT4 Indicator
Smart Market Structure Concepts V10 Forex Indicator MT4 |100% Non Repaint Indicator V10.0


MT4 Indicator


Reviews
There are no reviews yet.