
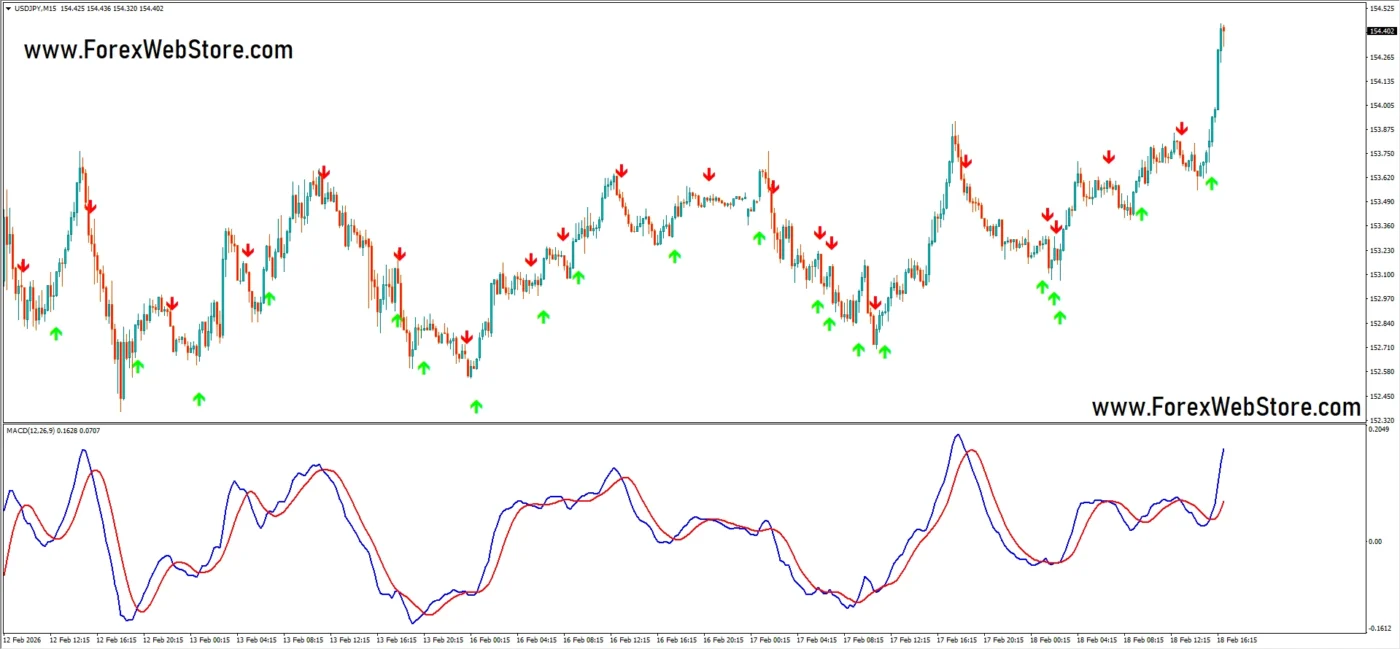
 Super Nifty 50 MT4 Indicator | 100% Non Repaint Indicator V24.0
 Free Indicator
Buy/Sell Arrow Signal system with MACD confirmation.
Feb
This indicator is a Buy/Sell Arrow Signal system with MACD confirmation (trend + momentum combination).
I’ll give you a clear mechanical strategy with:
- Entry
- Stop Loss
- Take Profit
- 1:2 Risk Reward
- Risk Management
No confusion. Simple rules.
✅ 1️⃣ Trend Confirmation (Very Important)
Before taking any arrow signal:
🔵 Buy Only If:
- MACD blue line is above red line
- Both lines are above 0 level (strong trend)
- Market structure showing higher highs & higher lows
🔴 Sell Only If:
- MACD blue line below red line
- Both lines below 0 level
- Lower highs & lower lows forming
Avoid taking signals against MACD direction.
✅ 2️⃣ Entry Rules
🔵 BUY Entry
Enter when:
- Green arrow appears
- MACD confirms bullish crossover
- Candle closes bullish
👉 Entry at next candle open.
🔴 SELL Entry
Enter when:
- Red arrow appears
- MACD confirms bearish crossover
- Candle closes bearish
👉 Entry at next candle open.
✅ 3️⃣ Stop Loss Placement
Never use random SL.
For BUY:
- Stop Loss below recent swing low
OR - 5–10 pips below arrow candle low (M15 timeframe)
For SELL:
- Stop Loss above recent swing high
OR - 5–10 pips above arrow candle high
Structure-based SL is safest.
✅ 4️⃣ Take Profit (1:2 Risk Reward Strategy)
Always maintain minimum 1:2 RR.
Example:
If SL = 20 pips
TP = 40 pips
Formula:
Risk = Entry – SL
For BUY:
TP = Entry + (Risk × 2)
For SELL:
TP = Entry – (Risk × 2)
✅ 5️⃣ Trailing Stop Option (Advanced)
When price moves 1R (same as SL distance):
- Move SL to breakeven
- Trail below recent swing low (for buy)
- Trail above swing high (for sell)
This increases profitability in strong trends.
✅ 6️⃣ Risk Management (Very Important)
Never risk more than:
- 1% per trade (recommended)
- 2% maximum
Lot Size Formula:
Lot Size = (Account Balance × Risk %) ÷ Stop Loss (pips value)
Example:
$1000 account
1% risk = $10
SL = 20 pips
Position size = Risk ÷ SL
✅ 7️⃣ Best Conditions for This Indicator
Works best:
- M15 timeframe
- London session
- New York session
- Trending pairs (GBPJPY, XAUUSD, NAS100, USDJPY)
Avoid:
- Sideways market
- Before high impact news
- When MACD flat around zero
✅ 8️⃣ Win Rate Improvement Trick
Only take:
- Arrow + MACD crossover
- Arrow in direction of overall trend
- Arrow after pullback
Skip early arrows in ranging zones.
🔥 Example on Your Chart (USDJPY M15)
Green arrow → MACD bullish →
Entry: 153.200
SL: 153.050 (15 pips risk)
TP: 153.500 (30 pips target = 1:2 RR)
Simple. Controlled. Professional.